
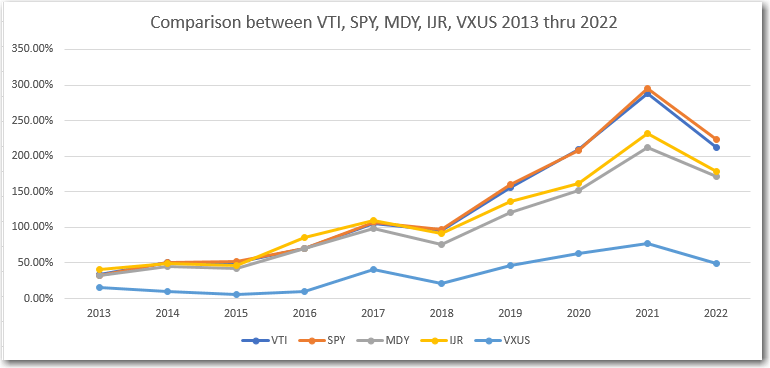
This graph show a 10 year comparison between VTI, SPY, MDY, IJR and VXUS
What the backtest showed
I intended to provide a Model ETF Portfolio on this site as a suggestion to those who are looking for long term Buy and Hold strategies. But once I crunched the numbers for the time period 2013 thru 2022, I was amazed by the lack of alpha that diversification provides over the long-term. Comparing ETF’s VTI, SPY, MDY, IJR and VXUS over the last 10 or 15 years shows that an investment in a single well diversified ETF, VTI, is all that is needed to provide a balanced return over the long term. Here is what the ETF’s used in the test represent.
- VTF – Vanguard Total Stock Market
- SPY – SPDR S&P 500
- MDY – SPDR® S&P MIDCAP 400
- IJR – iShares Core S&P Small-Cap
- VXUS – Vanguard Total International Stock
| 10 Year Average return | 15 Year Average return | |
| VTI | 11.20% | 9.80% |
| SPY | 11.60% | 9.80% |
| MDY | 9.50% | 9.70% |
| IJR | 9.90% | 9.90% |
| VXUS | 4.00% | 2.9% Estimated |
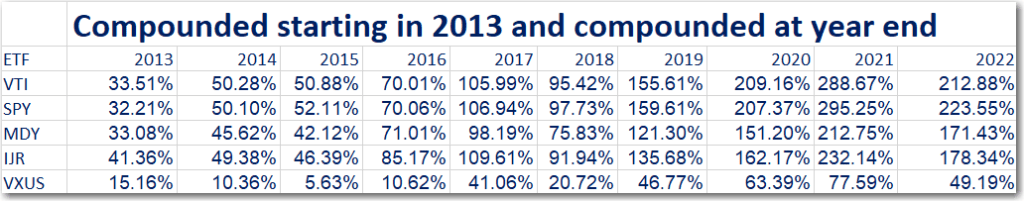
The numbers show that over the last 10 year period, there was little difference between the performance of VTI when compared to SPY. The slight difference is no doubt related to the fact that Mid Cap(MDY) and Small Cap(IJR) underperformed SPY during that time. VTI is composed of Large Cap(79.8%), Mid Cap(19.9%) and Small Cap(0.3%).
When examining the 15 year period, the results of Large Cap, Mid Cap and Small Cap are nearly identical at an average yearly return of around 9.8%. VTI and SPY exactly match each other over a 15 year period.
Sad to say, the International ETF investment represented by proxy VXUS is a very poor choice over the last 10 or 15 year period. There is no need to include this one in a high performing portfolio. Why torture yourself waiting for International stocks to make up for lost performance?
Conclusion: Having a Buy and Hold strategy works well over long periods and the use of VTI as the sole ETF used provides significant diversification and long term results. VTI has around 80% Large Cap and 20% smaller than Large Cap. Make sure to reinvest all dividends to put this investment on true autopilot.
All data used in these calculations and displays above, come from Morningstar.com .

You must be logged in to post a comment.