
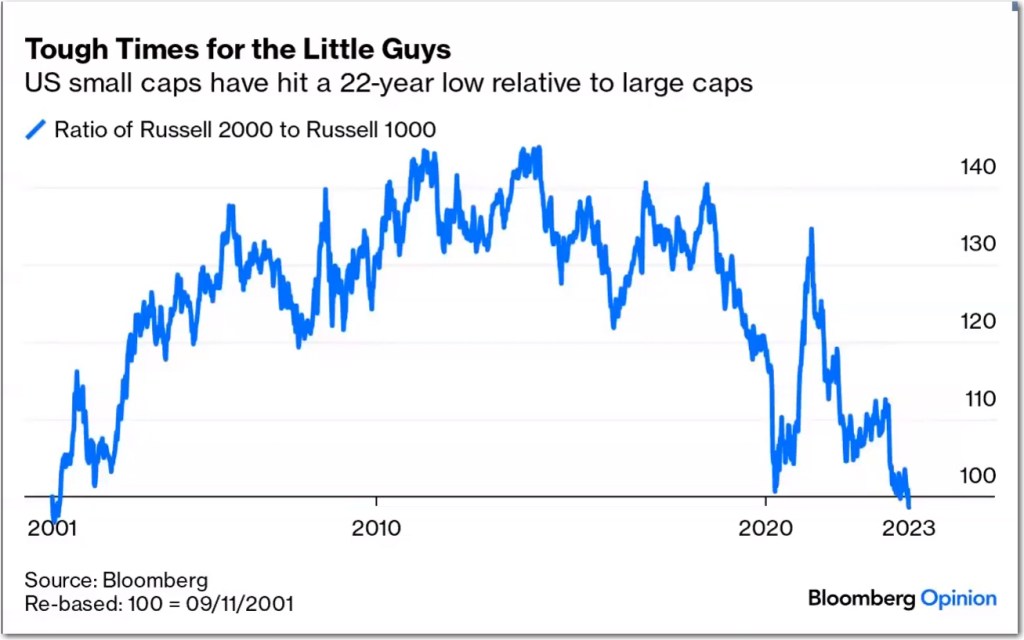
The Russell 2000 ( smallest 2,000 stocks in the Russell 3000 Index) is shown above to be outperforming the Russell 1000 ( largest 1,000 stocks in the Russell 3000 Index) all during the period from 2001 thru 2022. But the outperformance has ended with the dramatic strength of the Russell 1000 since 2018 reversing the trend. The mega caps in the Russell 1000 have powered most of this outperformance since 2018. It is only a matter of time until the trend reverses and Russell 2000 regains its dominance.
This week in the stock market was a down week for the indexes. The SPY was -3.0% with RSP -3.3% with MDY -2.8% and IJR -3.4%, for the week.
CANSLIM Growth Portfolio continues to be up over 15% for the year and easily outperforms its benchmark IJR by over 15%.
Small Cap Discoveries Portfolio remains up over 13% for the year well ahead of its benchmark, IJR.
Mid-cap Flyers is now 6% ahead of its benchmark MDY, for the year.
See the Mid Cap Flyers Portfolio Detail Here
Large Cap Stalwarts lags its benchmark RSP.

In the four Model Portfolios, Mid Cap Flyers, Small Cap Discoveries, CANSLIM Growth and Large Cap Stalwarts, the end-of-week stats are below.
2023 Performance as of 09/23/2023
| Small Cap Discoveries | +13.8% |
| IJR – Small Cap ETF Benchmark | -0.4% |
| CANSLIM Growth | +15.4% |
| IJR – Small Cap ETF Benchmark | -0.4% |
| Mid Cap Flyers | +8.8% |
| MDY – Mid Cap ETF Benchmark | +2.8% |
| Large Cap Stalwarts | -3.9% |
| RSP – S&P 500 Equal Weight ETF | +1.0% |
Backtests for the Four Model Portfolios
All content on this site is for informational purposes only and does not constitute financial advice. Consult relevant financial professionals in your country of residence to get personalised advice before you make any trading or investing decisions. Disclaimer
Copyright 2023 SwingTrader.Trading. All Rights Reserved.

You must be logged in to post a comment.