
- Quant 30 – Up over 19% since June
- Quant Weekly – Up over 31% since June
- Legacy – Up over 250% since April 2023
- Education – Historical Performance – Year 2 of the Presidential Cycle
The CNN Fear and Greed Index has finally come out of the Fear and Extreme Greed area and finished just barely in the Neutral area. The market can not decide if it wants to return to valuing a stock by its fundamentals or remain in the emotional reactive state it has been for the last two months. Our three Quant driven Portfolios continue to hold up well in this uncertain environment. When the day comes that fundamental s are back in charge of the stock market environment, I expect our stocks to lead the way up. We hold tight until then and just accumulate mis-priced stocks while waiting for the turnaround. Patience is needed.

Note: This site now offers both a free and a paid subscription. Paid subscribers receive weekly Portfolio updates as soon as they’re released. Free subscribers still get full content, but Portfolio updates will be posted with at least a two-week delay. Want timely access to the new Adds/Removes? Click here.
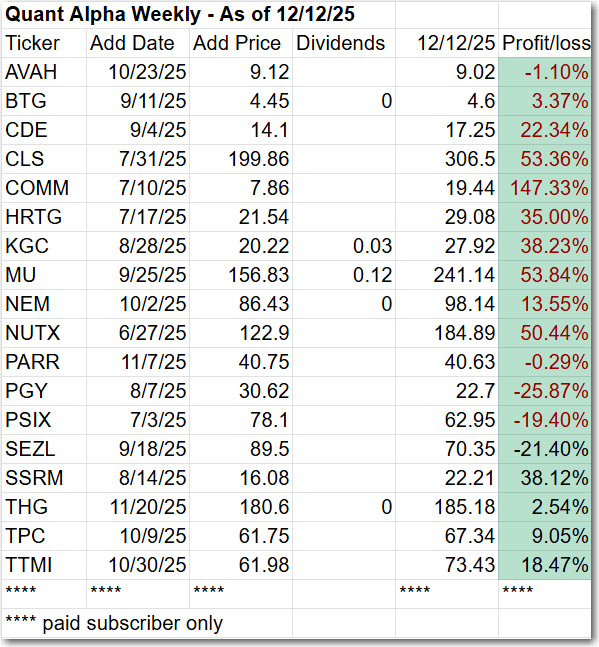
Model Portfolio Quant Alpha Weekly
The newly Added stock, if any, is being released to the Paid Subscribers today. Shown below is the stock Added two weeks ago. This Portfolio continues to beat its benchmark by a wide margin, 31% to 8%.
One Add was made to the Weekly portfolio for this update.
Add (12/05/25) : W (Wayfair)
What does Wayfair do?
Wayfair Inc. operates a global e-commerce platform focused on home goods, offering furniture, décor, housewares, and home-improvement items. Its family of sites includes Wayfair, Joss & Main, AllModern, Birch Lane, Perigold, and Wayfair Professional. The company also sells products under its in-house brands, such as Three Posts and Mercury Row. Founded in 2002, Wayfair is headquartered in Boston, Massachusetts.
Positives for Wayfair
- Wayfair’s Q3 2025 numbers popped off the page—9% revenue growth YoY and a 70% jump in adjusted EBITDA, showing the company’s finally running a tighter, more profitable operation.
- Strategic moves like the CastleGate logistics network and Wayfair Rewards are paying off, boosting market share, customer stickiness, and conversion rates across the board.
- In a rough macro backdrop where plenty of competitors are stumbling, Wayfair still shows strong demand and execution-driven growth, keeping it ahead of the pack.
Concerns for Wayfair:
- Wayfair’s valuation looks rich, trading at a premium to peers, raising questions about whether the growth pace is sustainable—especially with tariffs and macro uncertainty lurking.
- Even with better profitability, the company still carries elevated debt and relies heavily on flawless logistics execution, which could put pressure on already-tight margins.
- Insider selling and persistent net losses—despite solid top-line performance—keep skeptics worried about long-term financial stability.
Outperformers: CLS (Celestica) is up over 40%, COMM (CommScope) is up over +130%
Click here for the Quant Alpha Weekly details
Model Portfolio Quant 30
This week’s new update, if any, is being released to the paid subscribers. Shown below is the update made two weeks ago. This Portfolio continues to beat its benchmark by a wide margin, 19% to 8%.
One new Add and one Removal for this update.
Add (12/05/25) : BAC (Bank of America)
Remove (12/05/25) : XIACY (Xiaomi)
Outperformers: MU (Micron Technology) up over 110%, GFI (Gold Fields) up over 80% and CLS (Celestica) are up over 40%.
Click here for the Quant 30 details
Model Portfolio Quant Alpha’s – Legacy
The portfolio now has around 20 stocks in it. It is up over +250% since it began in 2023. Celestica achieves a 11 bagger performance.
Remove (12/05/25): None
Outperformers: AGX (Argan) up over 300%, WGS (GeneDx Holdings) up over 300%, STRL (Sterling Infrastructure) up over 400%, POWL (Powell Industries) up over 500% and CLS (Celestica) is up over 1100%
Click here for the Quant Alpha’s – Legacy details

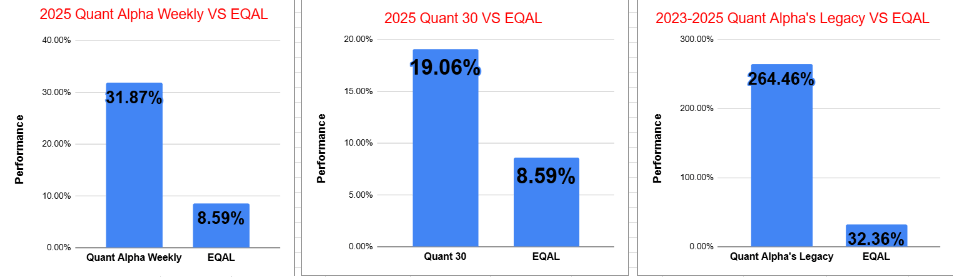
Performance to 12-19-2025
| Portfolio start date 6/27/25 | |
| Quant Alpha Weekly | 31.87% |
| EQAL (Russell 1000 Equal Weight ETF) | 8.59% |
| Portfolio start date 6/27/25 | |
| Quant 30 | 19.06% |
| EQAL (Russell 1000 Equal Weight ETF) | 8.59% |
| Portfolio start date 4/14/23 | |
| Quant Alpha’s – Legacy | 264.46% |
| EQAL (Russell 1000 Equal Weight ETF) | 32.36% |
Click here for the Live Quant scorecard

The Quant Alpha Weekly Portfolio remains ahead of its benchmark. Up over 31% since it began on June 27, 2025.
The Quant 30 Portfolio managed to close ahead of the benchmark once again. It is up 19% since it began on June 27, 2025.
The Quant Alpha’s – Legacy Portfolio maintained its over 250% return since April 2023, in a classic Position Trading Portfolio implementation.


Historical Performance – Year 2 of the Presidential Cycle
- Weakest year of the 4-year cycle: Historically, Year 2 has been one of the softer years for the stock market.
- Average return: Roughly +4% to +5% for the S&P 500 across long-term studies.
- Lower win rate: Markets have finished positive in about 60–65% of Year 2 periods — lower than Years 3 and 4.
- Volatility tends to rise: Midterm election uncertainty typically drives wider swings and deeper pullbacks.
- Frequent corrections: Year 2 historically sees the highest probability of a 10%+ correction, often occurring before midterm elections.
- Strong second-half rebound: Despite weak first-half returns, markets usually rebound sharply after midterms due to reduced political uncertainty.
- Year 2 bottom → strong Year 3: Historically, the market’s low in Year 2 often sets the stage for the strongest returns of the entire cycle in Year 3.
- Policy overhang: Year 2 often reflects fallout from first-year policy moves (tax shifts, regulations, spending changes).
- Fed cycles matter: Many Year 2s coincided with Fed tightening phases, adding pressure to equities.
- Sector dispersion widens: Defensive sectors (utilities, staples, healthcare) often outperform during weaker midterm-year conditions.
Bottom Line
Year 2 of the presidential cycle has historically been the choppiest, least rewarding, and most correction-prone year — but it frequently sets up the best buying opportunities ahead of the strong Year 3 rally.
Website Investment Educational Blog Posts –
All content on this site is for informational purposes only and does not constitute financial advice. Consult relevant financial professionals in your country of residence to get personalized advice before you make any trading or investing decisions. This post was written with the assistance of artificial intelligence. The original ideas and final review are human-generated. Disclaimer
Copyright 2023-2025 SwingTrader.Trading. All Rights Reserved.

You must be logged in to post a comment.