
- Quant 30 – Up over 28% since June
- Quant Weekly – Up over 41% since June
- Legacy – Up over 260% since April 2023
- Education – When do investments in oil industry stocks have the best chance of profit?
USA Stock Market recap Last Week
- S&P 500: Finished the week modestly lower, declining about 0.4% as profit-taking and mixed earnings weighed on large caps.
- Dow Jones Industrial Average: Slightly down, falling around 0.3% on the week after choppy trading.
- Nasdaq Composite: Led the downside among major benchmarks with roughly a 0.7% weekly drop.
- Russell 2000: Stood out with a 2.0% gain, reflecting continued strength in small-cap stocks.
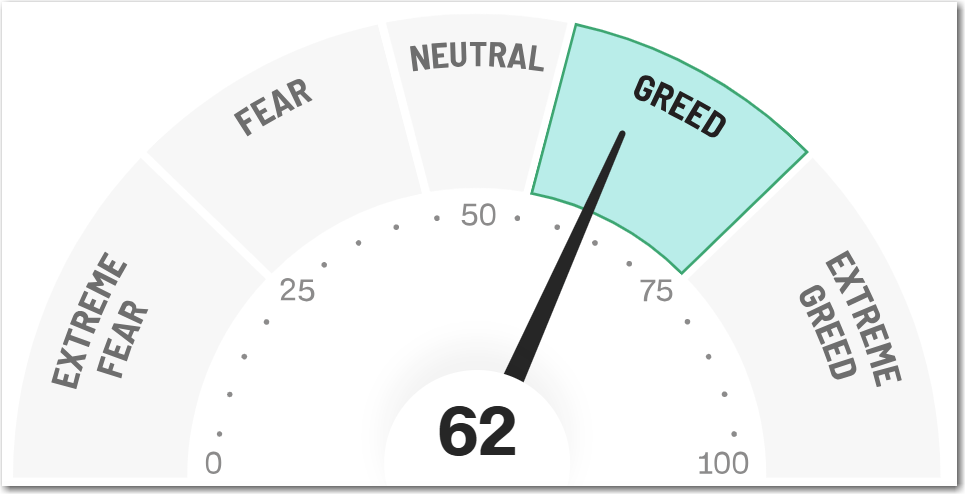
Investor Sentiment (CNN Fear & Greed Index):
- The CNN Fear & Greed Index remained in the Greed zone (around ~62/100) during this period, indicating bullish sentiment among investors despite the week’s mild pullback.
Overall, the U.S. equity market saw broad weakness in large-cap benchmarks for the week but continued outperformance in smaller stocks, with sentiment still tilted toward risk-taking as measured by the CNN Fear & Greed Index.
All three Quant Portfolios made all-time highs on a monthly comparison.

Note: This site now offers both a free and a paid subscription. Paid subscribers receive weekly Portfolio updates as soon as they’re released. Free subscribers still get full content, but Portfolio updates will be posted with at least a two-week delay. Want timely access to the new Adds/Removes? Click here.
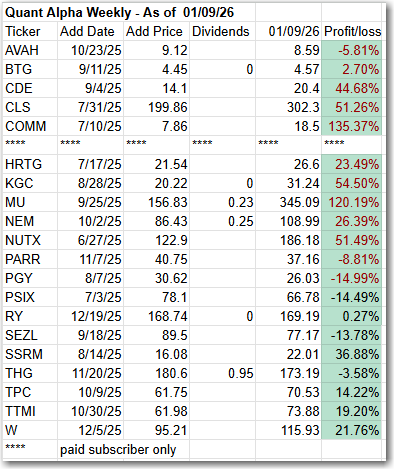
Model Portfolio Quant Alpha Weekly
The newly Added stock, if any, is being released to the Paid Subscribers today. Shown below are the updates from two weeks ago. This Portfolio continues to beat its benchmark by a wide margin, 41% to 12%.
CommScope (COMM) completed its $10 Billion partial buyout this week and changed its name and symbol to Vistance Networks (VISN). A special dividend will be paid to shareholders by Vistance a couple of months in the future. It is expected to be around $10 a share.
No Adds to the Portfolio this week
Add (01/02/26) : None
Outperformers: CLS (Celestica) up over 50%, MU (Micron Technology) up over 130%, VISN (Vistance Networks) up over +130%
Click here for the Quant Alpha Weekly details
Model Portfolio Quant 30
This week’s new update, if any, is being released to the paid subscribers. Shown below is the update made two weeks ago. This Portfolio continues to beat its benchmark by a wide margin, 28% to 12%.
A short review of Gold Fields (GFI) one of the Quant 30 stocks is provided below.
No new Adds for this update.
Add (01/02/26) : None
Remove (01/02/26) : None
Outperformers: MU (Micron Technology) up over 190%, GFI (Gold Fields) up over 100% and CLS (Celestica) are up over 50%.
Click here for the Quant 30 details
What does Gold Fields (GFI) do?
Gold Fields Limited operates as a gold producer with reserves and resources in Australia, South Africa, Ghana, Peru, Chile, and Canada. It also explores for copper and silver deposits. Gold Fields Limited was founded in 1887 and is based in Sandton, South Africa.
Gold Fields (PROS)
- Strong Profitability Metrics: Gold Fields posts robust returns, with 35.19% ROE, 17.34% ROA, a 28.72% net margin, and a 54.83% EBITDA margin, highlighting strong efficiency and pricing power.
- Solid Balance Sheet Health: A 40.88% debt-to-equity ratio and 4.28 Altman Z-Score reflect a conservative balance sheet and low financial risk.
- Strategic Growth Pipeline: Nineteen active exploration projects across four continents, alongside the Salares Norte ramp-up and the Gold Road Resources acquisition, expand production and strengthen exposure to Tier-1 Australia.
- Shareholder-Friendly Capital Allocation: A record interim dividend, up 133% year over year and equal to 34% of normalized earnings, underscores confidence in cash flow sustainability.
- Smart Expansion Strategy: Disciplined growth via joint ventures and equity stakes in high-margin, low-capex projects reduces acquisition risk while preserving upside.
Gold Fields (CONS)
- Jurisdictional Risk Exposure: Roughly half of production comes from non–Tier-1 regions, exposing operations to political, regulatory, and infrastructure risks.
- Gold Price Dependency: Earnings remain highly sensitive to gold prices, leaving margins vulnerable in a downturn.
- Valuation Concerns: Shares trade at a premium versus peers at ~16x forward EV/FCF, limiting upside and increasing correction risk if conditions weaken.
Model Portfolio Quant Alpha’s – Legacy
The portfolio now has around 19 stocks in it. It is up over +260% since it began in 2023. Celestica achieves a 12 bagger performance.
Remove (01/02/26): None
Outperformers: AGX (Argan) up over 400%, WGS (GeneDx Holdings) up over 200%, STRL (Sterling Infrastructure) up over 400%, POWL (Powell Industries) up over 600% and CLS (Celestica) is up over 1200%
Click here for the Quant Alpha’s – Legacy details

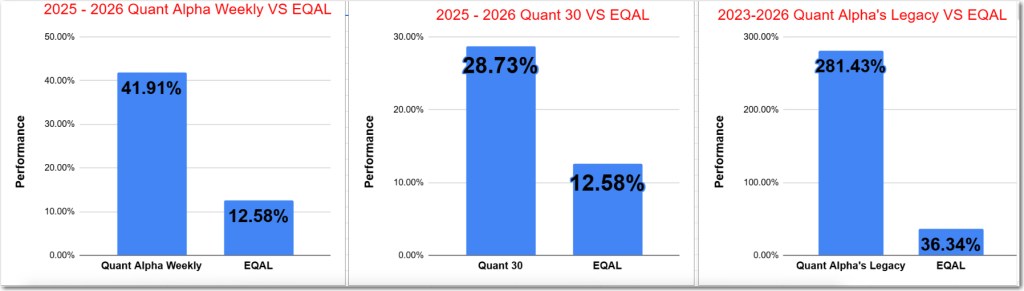
Performance to 01-16-2026
| Portfolio start date 6/27/25 | |
| Quant Alpha Weekly | 41.91% |
| EQAL (Russell 1000 Equal Weight ETF) | 12.58% |
| Portfolio start date 6/27/25 | |
| Quant 30 | 28.73% |
| EQAL (Russell 1000 Equal Weight ETF) | 12.58% |
| Portfolio start date 4/14/23 | |
| Quant Alpha’s – Legacy | 281.43% |
| EQAL (Russell 1000 Equal Weight ETF) | 36.34% |
Click here for the Live Quant scorecard

The Quant Alpha Weekly Portfolio remains ahead of its benchmark. Up over 41% since it began on June 27, 2025.
The Quant 30 Portfolio managed to close ahead of the benchmark once again. It is up 28% since it began on June 27, 2025.
The Quant Alpha’s – Legacy Portfolio maintained its over 260% return since April 2023, in a classic Position Trading Portfolio implementation.

When do investments in oil industry stocks have the best chance of profit?
Best Phase: Early to Mid Economic Expansion
(Recovery → Early Growth)
This is generally when oil stocks have the highest probability of strong returns.
Why:
- Economic activity begins to recover → demand for fuel, transport, and petrochemicals rises.
- Oil demand increases before supply can fully adjust (new drilling takes time).
- Oil prices tend to rise faster than costs.
- Energy companies’ earnings and cash flow expand rapidly.
- Valuations are often still low because sentiment is recovering from the prior downturn.
Historically, oil stocks often lead the broader market early in expansions.
Secondary Sweet Spot: Late Recovery After an Oil Downturn
(Oil-specific cycle, not necessarily economic)
Oil stocks can also do very well before the broader economy looks strong, if:
- Oil prices have collapsed previously,
- Capital spending has been cut sharply,
- Supply tightens due to underinvestment.
This creates powerful rebounds even if GDP growth is only modest.
Less Favorable Phases
Late Expansion
- Demand is strong, but:
- Oil prices may already be high,
- Costs (labor, services) rise,
- Governments may intervene (windfall taxes, SPR releases),
- Margins can peak and then compress.
- Returns tend to be more volatile and less attractive.
Recession
- Demand destruction hits quickly.
- Oil prices often fall sharply.
- Energy stocks usually underperform, except for short-term trading rallies.
Inflationary Environments (Special Case)
Oil stocks often perform better than the market when:
- Inflation is rising,
- Energy prices are a major inflation driver,
- Investors seek real assets and cash-flow-heavy companies.
This often overlaps with early to mid expansion or supply shocks.
Practical Rule of Thumb
Oil stocks tend to offer the best risk–reward when:
- The economy is emerging from recession, and
- Oil prices are recovering from a trough, and
- Energy companies are still priced pessimistically.
Worst risk–reward is usually:
- When oil prices are very high,
- Headlines are euphoric,
- Capital spending is ramping aggressively.
Where are we in the economic cycle now?
Phase: Late Expansion / Early Deceleration
- Economic growth persists, but at a slower and more moderate pace than earlier in the expansion.
- Inflation is cooling, the labor market is softening, and monetary policy is neutral to easing — signals often seen as expansions nearing maturity.
- Recession is not yet confirmed, but risks of slowdown or stagnation have increased.
Top three Energy stocks in the Quant system.
- NGL – NGL Energy Partners LP Common Units
- NTOIY – Neste Oyj
- NBR – Nabors Industries Ltd.
Website Investment Educational Blog Posts –
All content on this site is for informational purposes only and does not constitute financial advice. Consult relevant financial professionals in your country of residence to get personalized advice before you make any trading or investing decisions. This post was written with the assistance of artificial intelligence. The original ideas and final review are human-generated. Disclaimer
Copyright 2023-2026 SwingTrader.Trading. All Rights Reserved.

One response to “Wall Street Pauses: Large Caps Slip While Small-Caps Lead the Market – Update 01/20/26”
[…] Education – What is the January barometer in the USA stock market? […]
LikeLike