
- Quant 30 – Up over 32% since June
- Quant Weekly – Up over 47% since June
- Legacy – Up over 260% since April 2023
- Education – What is the January barometer in the USA stock market?
USA stock market results last week
- S&P 500: Finished the week down about 0.4%, extending recent volatility after mixed macro and earnings news.
- Dow Jones Industrial Average: Ended the week down around 0.5%, with tech and cyclical pressure outweighing mid-week gains.
- Nasdaq Composite: Slightly down roughly 0.1% for the week, as chip stock weakness offset gains in other growth names.
- Russell 2000: Small caps also slipped about 0.3%, even after earlier mid-week rebounds.
The Quant Weekly and Quant 30 portfolios closed last week at all-time highs. It was the second week in a row.

Note: This site now offers both a free and a paid subscription. Paid subscribers receive weekly Portfolio updates as soon as they’re released. Free subscribers still get full content, but Portfolio updates will be posted with at least a two-week delay. Want timely access to the new Adds/Removes? Click here.
Model Portfolio Quant Alpha Weekly
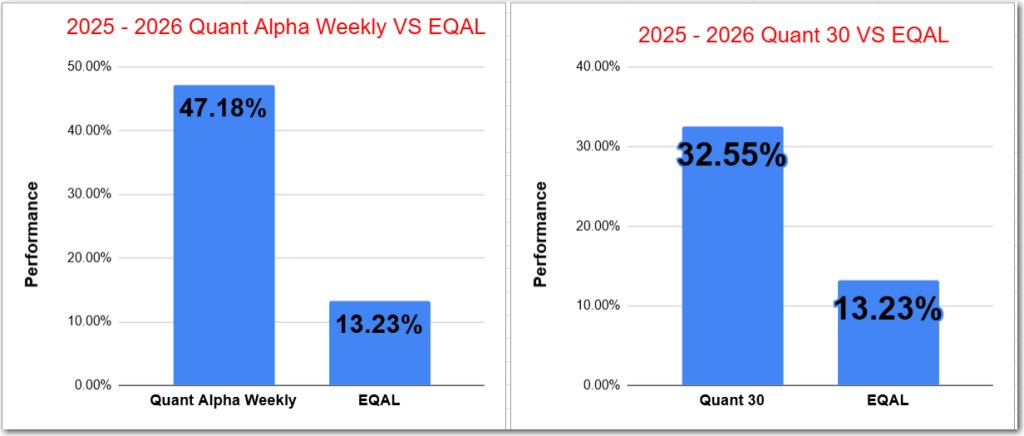
The newly Added stock, if any, is being released to the Paid Subscribers today. Shown below are the updates from two weeks ago. This Portfolio continues to beat its benchmark by a wide margin, 47% to 12%.
One Add to the Portfolio this week
Add (01/09/26) : GM (General Motors)
Outperformers: CDE (Coeur Mining) up over 80%, MU (Micron Technology) up over 150%, VISN (Vistance Networks) up over +120%
Click here for the Quant Alpha Weekly details
Quant Weekly Performance – Weekly Summary
Overall Takeaway
The portfolio had a mixed but relatively resilient week.
- Precious metals and gold miners provided stability and modest upside.
- Semiconductors and AI-linked names were mixed but generally held up.
- Small-cap, consumer, and specialty stocks saw more downside pressure amid choppy markets.
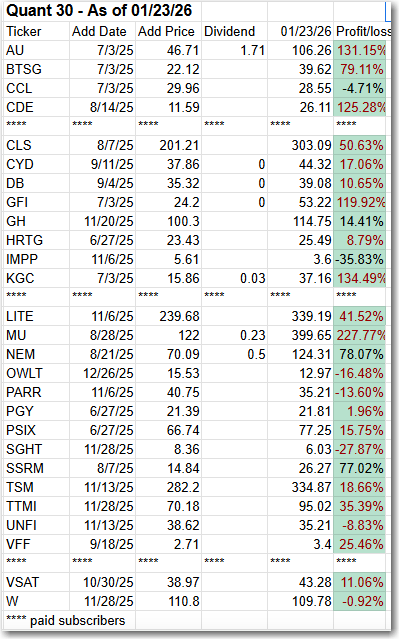
Model Portfolio Quant 30
This week’s new update, if any, is being released to the paid subscribers. Shown below is the update made two weeks ago. This Portfolio continues to beat its benchmark by a wide margin, 32% to 12%.
No new Adds for this update.
Add (01/09/26) : None
Remove (01/09/26) : None
Outperformers: MU (Micron Technology) up over 220%, GFI (Gold Fields) up over 110% and KGC (Kinross Gold) is up over 130%.
Click here for the Quant 30 details
Model Portfolio Quant Alpha’s – Legacy
The portfolio now has around 19 stocks in it. It is up over +260% since it began in 2023. Celestica achieves a 11 bagger performance.
Remove (01/09/26): None
Outperformers: AGX (Argan) up over 400%, WGS (GeneDx Holdings) up over 200%, STRL (Sterling Infrastructure) up over 400%, POWL (Powell Industries) up over 600% and CLS (Celestica) is up over 1100%
Click here for the Quant Alpha’s – Legacy details

Performance to 01-23-2026
| Portfolio start date 6/27/25 | |
| Quant Alpha Weekly | 47.14% |
| EQAL (Russell 1000 Equal Weight ETF) | 12.98% |
| Portfolio start date 6/27/25 | |
| Quant 30 | 32.39% |
| EQAL (Russell 1000 Equal Weight ETF) | 12.98% |
| Portfolio start date 4/14/23 | |
| Quant Alpha’s – Legacy | 279.85% |
| EQAL (Russell 1000 Equal Weight ETF) | 36.74% |
Click here for the Live Quant scorecard

The Quant Alpha Weekly Portfolio remains ahead of its benchmark. Up over 47% since it began on June 27, 2025.
The Quant 30 Portfolio remains ahead of its benchmark. With new earnings reports coming out, the pace of turnover is increasing. It is up 32% since it began on June 27, 2025.
The Quant Alpha’s – Legacy Portfolio maintained its over 260% return since April 2023, in a classic Position Trading Portfolio implementation.

What is the January barometer in the USA stock market?
The January Barometer is a long-running market adage that says:
“As goes January, so goes the year.”
What it means
- The direction of the S&P 500 in January (up or down) is viewed as a signal for the full calendar year’s trend.
- A positive January suggests a higher probability of a positive year.
- A negative January is seen as a warning of weaker or more volatile markets.
- The idea is that early-year institutional positioning, fresh capital flows, and investor sentiment reveal how risk appetite is shaping up.
How accurate is it?
- Historically, the January Barometer has been correct about 70–75% of the time when predicting whether the year ends up or down.
- Its track record is stronger after positive Januaries than after negative ones.
- The indicator tends to work best as a trend confirmation tool, not a precise forecasting or timing signal.
Key limitations
- It does not predict the size of returns, only the direction.
- Major macro events (recessions, rate shocks, policy changes) can override it.
- Accuracy has been less consistent in recent decades.
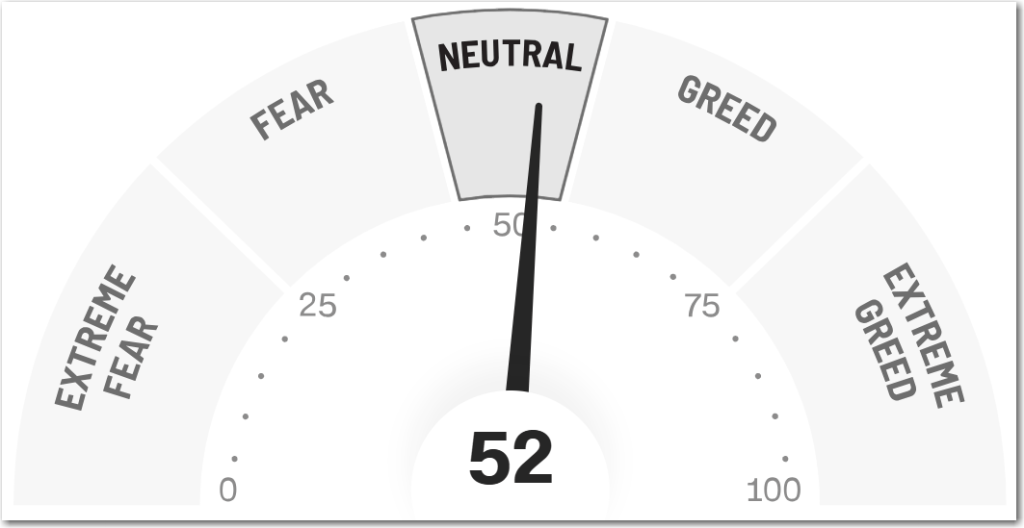
Is the January Barometer positive right now?
Because the S&P 500 and other key indexes are showing gains in January, the January Barometer would currently be indicating a bullish signal for the potential trend of the full year. Positive January returns historically tend to correlate with a higher probability that the S&P 500 will end the year higher.
Bottom line
The January Barometer is a useful sentiment gauge, offering an early read on market tone, but it should be used alongside earnings trends, economic data, and broader market analysis—not as a standalone investment signal.
Website Investment Educational Blog Posts –
All content on this site is for informational purposes only and does not constitute financial advice. Consult relevant financial professionals in your country of residence to get personalized advice before you make any trading or investing decisions. This post was written with the assistance of artificial intelligence. The original ideas and final review are human-generated. Disclaimer
Copyright 2023-2026 SwingTrader.Trading. All Rights Reserved.

You must be logged in to post a comment.