
- Quant 30 – Up over 32% since June
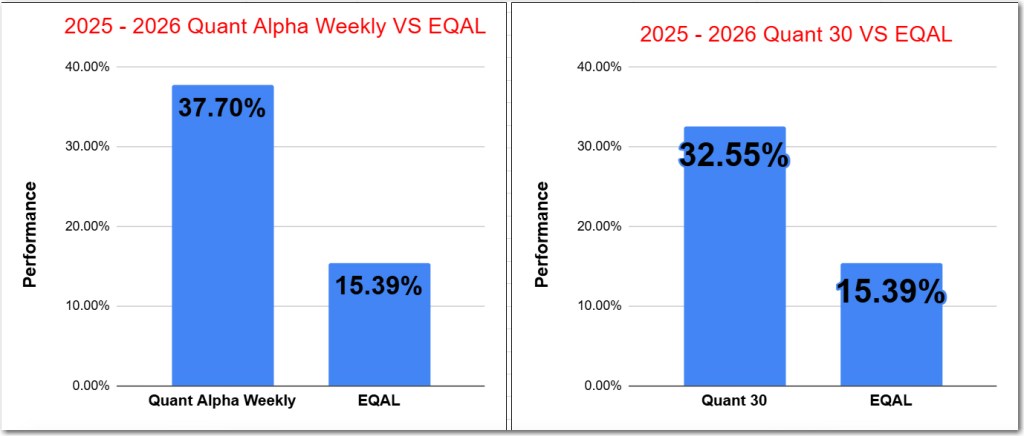
- Quant Weekly – Up over 37% since June
- Legacy – Up over 270% since April 2023
- Education – How does the USA software industry perform in the stock market over time?
USA Stock market last week 02/06/26
- S&P 500: Essentially flat to slightly down (~-0.1% on the week).
- Dow Jones Industrial Average: Up comfortably, gaining ~+2.5% and closing above 50,000 for the first time.
- Nasdaq Composite: Down on the week, approximately -1.8% overall.
- Russell 2000 (small-cap index): Up about +2.2% for the week.
Context: Despite steep mid-week selling—especially in technology—indexes rebounded strongly on Friday, with broad gains led by cyclical and tech names.
Industry & Sector Trends (Week of Feb 2–6, 2026)
Strongest Performing Segments
- Industrial & Cyclicals: Led gains as economically sensitive stocks (like heavy equipment and financials) rallied late in the period, contributing to the Dow’s advance.
- Technology (rebound Friday): Major chipmakers and tech leaders rallied sharply on Friday, supporting upside—even though overall the Nasdaq finished lower for the week.
- Small Caps: Russell 2000’s weekly gain suggests renewed risk appetite for smaller, more cyclical equities.
- Travel & Consumer Service Sectors: Airline stocks and other discretionary names showed gains associated with improved sentiment.
Weakest Performing Segments
- Technology (mid-week pressure): Heavy early and mid-week selling in tech and AI-linked stocks dragged the Nasdaq and related sectors lower before the Friday rebound.
- Consumer Discretionary (headwinds mid-week): Some retail and discretionary names underperformed amid risk-off sentiment earlier in the week.
- Defensive/Profitability Concerns: Select large cap growth names faced profit-margin pressure tied to expected capital expenditures (e.g., some software stocks earlier in the week).
The Quant 30 and Quant Alpha’s Legacy Model Portfolios closed the week at all-time highs.

Note: Choose between free and paid subscription levels. Paid subscribers enjoy instant access to weekly Portfolio updates upon release. Free subscribers access identical content, with Portfolio updates published after a two-week waiting period. Want timely access to the new Adds/Removes? Click here.
Model Portfolio Quant Alpha Weekly
Any newly added stock is being released to Paid Subscribers today. Below are the updates from two weeks ago. This Portfolio continues to significantly outperform its benchmark, 37% versus 15%.”
No Adds to the Portfolio this week
Add (01/23/26) : NONE
Outperformers: CDE (Coeur Mining) up over 50%, MU (Micron Technology) up over 150%, VISN (Vistance Networks) up over +140%
Click here for the Quant Alpha Weekly details
Model Portfolio Quant 30
This week’s new update, if any, is being released to the paid subscribers. Shown below is the update made two weeks ago. This Portfolio continues to beat its benchmark by a wide margin, 32% to 15%.
One new Add for this update.
Add (01/23/26) : NUTX (Nutex Health)
Remove (01/23/26) : IMPP (Imperial Petroleum)
Outperformers: MU (Micron Technology) up over 220%, GFI (Gold Fields) up over 120% and KGC (Kinross Gold) is up over 100%.
Click here for the Quant 30 details
Quant 30 Performance – Weekly Summary
Simple sector breakdown (equal‑weight)
Semiconductors / tech hardware (TSM, MU, etc.): Net positive; TSM and MU alone probably account for more than half of the week’s gain for the basket.
Gold and precious‑metals miners (AU, GFI, etc.): Mild to solid positive; gold names generally trended up on the week.
Cyclicals, energy, and industrials (CCL, PARR, etc.): Mixed to slightly negative as a group, dampening the strong moves in semis and miners.
Healthcare / biotech and misc. growth (GH, OWLT, etc.): Wide dispersion; GH and a few others had good weeks, but recent volatility and pullbacks in high‑beta names like W likely made this sleeve net flat to slightly negative.
Model Portfolio Quant Alpha’s – Legacy
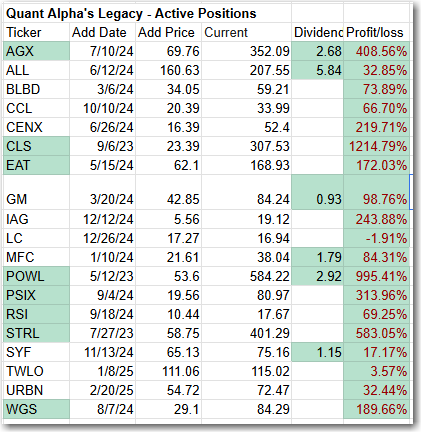
The portfolio now has around 19 stocks in it. It is up over +270% since it began in 2023. Celestica achieves a 12 bagger performance.
Remove (01/23/26): None
Outperformers: AGX (Argan) up over 400%, PSIX (Power Solutions) up over 300%, STRL (Sterling Infrastructure) up over 500%, POWL (Powell Industries) up over 900% and CLS (Celestica) is up over 1200%
Click here for the Quant Alpha’s – Legacy details

Performance to 02-06-2026
| Portfolio start date 6/27/25 | |
| Quant Alpha Weekly | 37.70% |
| EQAL (Russell 1000 Equal Weight ETF) | 15.39% |
| Portfolio start date 6/27/25 | |
| Quant 30 | 32.55% |
| EQAL (Russell 1000 Equal Weight ETF) | 15.39% |
| Portfolio start date 4/14/23 | |
| Quant Alpha’s – Legacy | 299.41% |
| EQAL (Russell 1000 Equal Weight ETF) | 39.15% |
Click here for the Live Quant scorecard

The Quant Alpha Weekly Portfolio remains ahead of its benchmark. Up over 37% since it began on June 27, 2025.
The Quant 30 Portfolio remains ahead of its benchmark. It is up 32% since it began on June 27, 2025.
The Quant Alpha’s – Legacy Portfolio maintained its over 270% return since April 2023, in a classic Position Trading Portfolio implementation.

How does the USA software industry perform in the stock market over time?
1. Long-Term Outperformance of Tech & Software
- Tech leadership since the Global Financial Crisis: U.S. technology stocks — including major software companies — have outperformed the broader market over the past decade-plus. For example, the overall tech sector contributed heavily to the S&P 500’s strong long-term returns since 2009.
- Large software-oriented companies like Microsoft have posted very strong returns (e.g., ~26–27% annualized over ~10 years), illustrating how core software and cloud/AI players have driven gains.
Why this happened
- Shift to subscription/SaaS models — recurring revenue streams boosted valuations relative to traditional software sales.
- Cloud computing growth drove demand for enterprise software platforms.
- AI and digital transformation narratives have increasingly influenced investor expectations.
2. Booms and Busts: Cycles Matter
Dot-com Era & Recovery
- The dot-com crash (2000–2002) deeply hit tech/software stocks, and the NASDAQ took ~15 years to recover to its prior peak.
- After that, as software matured and delivered real earnings, valuations climbed steadily through the 2010s.
2010s – Mid-2020s
- Software companies helped fuel the tech boom, especially with the rise of cloud services and later AI.
- However, not all software stocks performed equally. Many large enterprise SaaS names saw significant pullbacks when growth slowed or valuations compressed.
Recent Trends (2024–2026)
- While mega-cap software and AI-linked stocks (like Microsoft) have generally delivered positive returns, others have struggled; some legacy or smaller SaaS names fell sharply as investor sentiment shifted.
- A key factor in 2025–2026 has been AI disruption fears — with some traditional software valuations under pressure as markets reassess how AI changes growth prospects.
3. Industry-Wide Metrics & Forecasts
Performance Metrics
- U.S. software stocks’ short-term performance has been mixed in recent years, with some indexes showing modest gains but many individual stocks lagging due to valuation re-rating and competitive pressures.
Growth Expectations
- Analysts see continued earnings growth in software, albeit at slightly lower rates than some recent record levels.
4. What This Means for Investors
Key historical takeaways:
- Long-term growth: U.S. software has been a core driver of stock market returns compared to the broader market over decades.
- Volatility and rotation: Periods of strong performance alternate with correction phases — often tied to macro conditions, growth expectations, or technological shifts (internet → cloud → AI).
- Differentiation matters: Larger, diversified software/cloud/AI firms have historically outperformed many smaller or niche players.
Risks to watch:
- Market sentiment around transformative tech (e.g., AI) can compress valuations rapidly.
- Competition and pricing pressures in software markets — especially with new AI tools — can erode future revenue expectations.
Eight major, U.S‑listed software leaders and their approximate 5‑year price returns
- Microsoft (MSFT): roughly +200% to +250% over 5 years, powered by cloud (Azure), Office 365 and AI‑related growth.
- Oracle (ORCL): roughly +150% to +200%, reflecting its successful pivot into cloud infrastructure and applications.
- Adobe (ADBE): roughly +120% to +170%, driven by Creative Cloud and Digital Experience subscription growth.
- Salesforce (CRM): roughly +80% to +130%, as it expanded core CRM, analytics, and Slack‑related offerings.
- ServiceNow (NOW): roughly +150% to +220%, supported by very strong subscription growth and high net retention.
- Intuit (INTU): roughly +140% to +200%, helped by TurboTax, QuickBooks, and the Mailchimp acquisition.
- Palo Alto Networks (PANW): roughly +180% to +260%, reflecting strong demand for next‑gen cybersecurity platforms.
- CrowdStrike (CRWD): roughly +200% to +300%, driven by rapid ARR growth in endpoint and cloud security.
Website Investment Educational Blog Posts –
All content on this site is for informational purposes only and does not constitute financial advice. Consult relevant financial professionals in your country of residence to get personalized advice before you make any trading or investing decisions. This post was written with the assistance of artificial intelligence. The original ideas and final review are human-generated. Disclaimer
Copyright 2023-2026 SwingTrader.Trading. All Rights Reserved.

You must be logged in to post a comment.