
- Quant 30 – Up over 24% since June 2025
- Quant Weekly – Up over 26% since June 2025
- Legacy – Up over 270% since April 2023
- Education – How do Value stocks compare to Growth stocks over time?
USA Stock market last week 03/13/26
Weekly returns across major U.S. indexes (approx):
- S&P 500: -1.5% for the week as geopolitical tensions and rising oil prices pressured equities.
- Nasdaq Composite: -1.2% for the week, with technology stocks leading much of the decline.
- Dow Jones Industrial Average: -1.9% for the week as cyclicals and financials weakened amid macro concerns.
- Russell 2000: -1.7% for the week as small-cap stocks underperformed during the risk-off environment
Takeaways:
- Rising oil prices driven by geopolitical tensions and disruptions near the Strait of Hormuz.
- Inflation fears tied to higher energy costs.
- Higher Treasury yields, which pressured high-growth stocks.
- Risk-off sentiment, leading investors toward defensive sectors like utilities and staples.
Market Drivers This Week (03/16/26 – 03/20/26)
- Mon, Mar 16 – U.S. Retail Sales Report
- A key indicator of consumer spending and economic momentum. Strong or weak retail sales can significantly move consumer discretionary and retail stocks.
- Tue, Mar 17 – Federal Reserve FOMC Meeting Begins
- The two-day Federal Reserve policy meeting begins, with investors closely watching for signals about future interest-rate policy.
- Wed, Mar 18 – U.S. Producer Price Index (PPI)
- Inflation data measuring wholesale prices provided clues about future consumer inflation and potential Fed policy responses.
- Wed, Mar 18 – Federal Reserve Policy Decision
- The Fed released its rate decision and updated outlook for interest rates, economic growth, and inflation, often one of the most significant market catalysts each quarter.
- Thu, Mar 19 – Global Central Bank Activity
- Policy decisions from major global central banks (including the ECB and BOJ) contribute to global market volatility and currency movements.
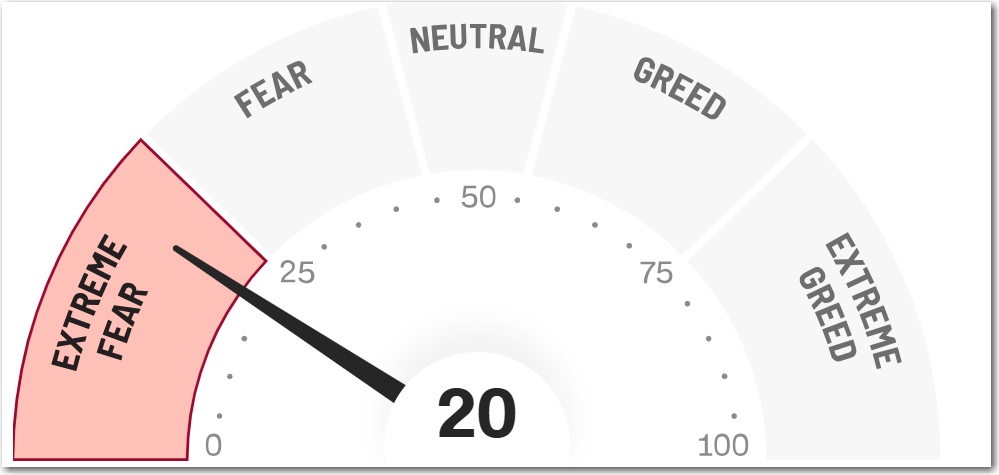
The CNN Fear and Greed Index ends the week at Extreme Fear 20. After four weeks in the Fear rank the Index has dropped to the lowest rank.
The Quant 30 and Quant Weekly Model Portfolios dropped slightly this week reflecting the overall market drop. The Middle East war continues to bring uncertainty to the market direction.

Note: Choose between free and paid subscription levels. Paid subscribers enjoy instant access to weekly Portfolio updates upon release. Free subscribers access Portfolio updates after a three-week delay. Want timely access to the new Adds/Removes? Click here.
Model Portfolio Quant Alpha Weekly
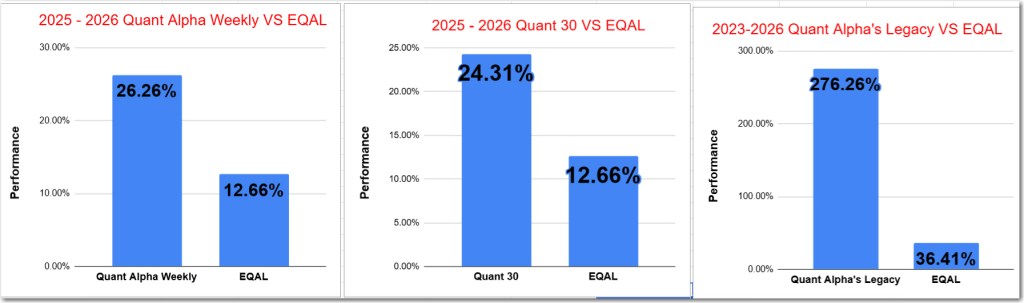
Any newly added stock is being released to Paid Subscribers today. Below are the updates from three weeks ago. This Portfolio continues to significantly outperform its benchmark, 26% versus 12%.
One Add to the Portfolio this week
Add (02/20/26) : LITE (Lumentum Holdings)
Remove (02/20/26): NONE
Outperformers: SSRM (SSR Mining) up over 70%, MU (Micron Technology) up over 170%, VISN (Vistance Networks) up over +120%
Click here for the Quant Alpha Weekly details
Model Portfolio Quant 30
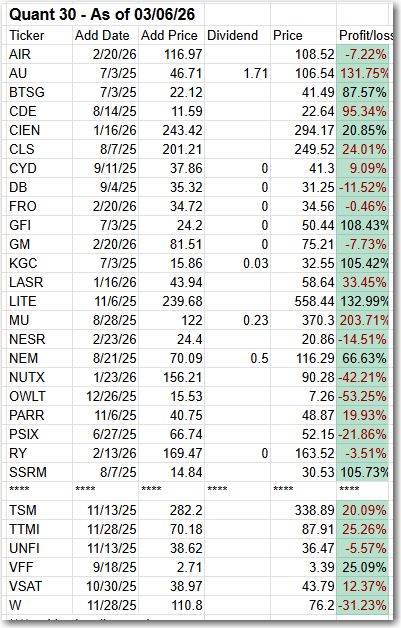
This week’s new update, if any, is being released to the paid subscribers. Shown below is the update made three weeks ago. This Portfolio continues to beat its benchmark by a wide margin, 24% to 12%.
Three Adds to the Portfolio this week
Add (02/20/26): NESR (National Energy Services) , FRO (Frontline plc) , GM (General Motors) , AIR (AAR Corp)
Remove (02/20/26): SGHT (Sight Sciences) , HRTG (Heritage Insurance) , VISN (Vistance Networks), GH (Guardant Health)
Outperformers: MU (Micron Technology) up over 240%, GFI (Gold Fields) up over 80%, LITE (Lumentum Holdings) up over 150% and KGC (Kinross Gold) is up over 90%.
Click here for the Quant 30 details
Model Portfolio Quant Alpha’s – Legacy
The portfolio now has around 19 stocks in it. It is up over +270% since it began in 2023. Celestica in now a 10 bagger.
Remove (02/20/26): None
Outperformers: AGX (Argan) up over 500%, STRL (Sterling Infrastructure) up over 500%, POWL (Powell Industries) up over 800% and CLS (Celestica) is up over 1000%
Click here for the Quant Alpha’s – Legacy details

Performance to 03-13-2026
| Portfolio start date 6/27/25 | |
| Quant Alpha Weekly | 26.26% |
| EQAL (Russell 1000 Equal Weight ETF) | 12.71% |
| Portfolio start date 6/27/25 | |
| Quant 30 | 24.31% |
| EQAL (Russell 1000 Equal Weight ETF) | 12.71% |
| Portfolio start date 4/14/23 | |
| Quant Alpha’s – Legacy | 276.27% |
| EQAL (Russell 1000 Equal Weight ETF) | 36.47% |
Click here for the Live Quant scorecard

The Quant Alpha Weekly Portfolio remains ahead of its benchmark. Up over 26% since it began on June 27, 2025.
The Quant 30 Portfolio remains ahead of its benchmark. It is up 24% since it began on June 27, 2025.
The Quant Alpha’s – Legacy Portfolio maintained its over 270% return since April 2023, in a classic Position Trading Portfolio implementation.

How do Value stocks compare to Growth stocks over time?
Key Findings:
- Growth dominated for most of the period (2011-2020, 2023-2024), winning 10 out of 15 years
- Value significantly outperformed in 2022 when growth fell -29.3% vs value’s -7.7%
- 2025-2026 marks a shift: Value is currently outperforming growth by nearly 14 percentage points YTD
- Average annual returns: Growth 14.9% vs Value 10.3% over the full period
- Best year for Value: 2013 at 32.1%
- Best year for Growth: 2023 at 42.6%
Break it down by Year:
| Year | Russell 3000 Value | Russell 3000 Growth | Difference | Winner |
|---|---|---|---|---|
| 2011 | 0.1% | 2.6% | -2.5% | Growth |
| 2012 | 17.5% | 15.3% | +2.2% | Value |
| 2013 | 32.1% | 33.5% | -1.4% | Growth |
| 2014 | 13.2% | 13.1% | +0.1% | Value |
| 2015 | -4.0% | 1.2% | -5.2% | Growth |
| 2016 | 17.3% | 7.1% | +10.2% | Value |
| 2017 | 13.5% | 30.2% | -16.7% | Growth |
| 2018 | -8.4% | -1.5% | -6.9% | Growth |
| 2019 | 26.1% | 36.4% | -10.3% | Growth |
| 2020 | 2.7% | 38.5% | -35.8% | Growth |
| 2021 | 25.0% | 27.4% | -2.4% | Growth |
| 2022 | -7.7% | -29.3% | +21.6% | Value |
| 2023 | 11.4% | 42.6% | -31.2% | Growth |
| 2024 | 14.2% | 33.1% | -18.9% | Growth |
| 2025 | 15.7% | 18.3% | -2.6% | Growth |
| Years Won | 4 Value / 11 Growth | |||
How do Value and Growth stocks compare to each other this year?
Year-to-Date Performance (through early March 2026):
Russell 3000 Value has surged to an 8.9% year-to-date gain, while large-cap growth has declined 4.8%, creating a nearly 14-percentage-point performance gap — one of the most significant leadership shifts since the early 2000s.
Key Performance Metrics:
- Russell 1000 Value (IWD): Up 4% year-to-date in 2026 and 11% over the past 6 months
- Russell 1000 Growth (IWF): Up approximately 90% over the past five years but significantly underperforming value in 2026
- Russell 2000 Value: Leading with an 8.9% YTD gain, dramatically outpacing growth
- Overall Russell 3000 Value vs Growth: The Russell 1000 Value Index has advanced 8.6% from early November through February, beating its growth counterpart by 14 percentage points.
Website Investment Educational Blog Posts –
All content on this site is for informational purposes only and does not constitute financial advice. Consult relevant financial professionals in your country of residence to get personalized advice before you make any trading or investing decisions. This post was written with the assistance of artificial intelligence. The original ideas and final review are human-generated. Disclaimer
Copyright 2023-2026 SwingTrader.Trading. All Rights Reserved.
