
- Quant 30 – Up over 32% since June 2025
- Quant Weekly – Up over 33% since June 2025
- Legacy – Up over 270% since April 2023
- Education – When the CNN.COM Fear and Greed Index is four weeks at the Extreme Fear level, what is the performance of the S&P500 index in the 6 months following?
USA Stock market week ending 04/03/26
Major Index Performance (Weekly)
- S&P 500: +3.4% (weekly) — rebounded strongly after early-week weakness
- Nasdaq: +4.4% (weekly) — led gains, driven by tech strength
- Dow Jones: Solid weekly gain (+3.0%) — lagged slightly vs. Nasdaq
- Russell 2000: (+3.3%) Outperformed late week; positive overall — small caps showed relative strength
Takeaways
- Despite a weak start, markets staged a powerful rebound, with Nasdaq leading and small caps gaining momentum late.
- The week was dominated by geopolitical risk and oil prices, creating a split market: energy & defensives up, consumer sectors down.
- Overall tone: risk-on recovery with macro overhang still elevated.
Market Drivers Next Week (04/06/26 – 04/10/26)
- Mon, Apr 6 — March Jobs Report Reaction: Markets finally react to Friday’s jobs data (released on Good Friday when markets were closed), with economists expecting 57,000 jobs added in March — a recovery from the prior month’s loss of 92,000 — and unemployment holding at 4.4%.
- Mon, Apr 6 — U.S.-Iran Diplomatic Deadline: The single most watched event of the week. President Trump set April 6 as the deadline for Iran diplomacy — a de-escalation could quickly reverse oil prices and ease inflation fears, while further escalation risks pushing crude even higher and deepening stagflation concerns.
- Ongoing — Oil Prices & Strait of Hormuz: Brent crude is trading above $110/barrel amid fears of a prolonged Strait of Hormuz closure. Energy is the standout sector of 2026, up over 41% YTD, while elevated oil prices continue to feed directly into headline inflation and weigh on consumer spending.
- Tue, Apr 7 — ISM Services PMI (March): A critical read on the health of the U.S. service sector — the dominant driver of domestic GDP — as analysts watch for signs that rising energy costs and softening consumer demand are beginning to bite.
- Wed, Apr 9 — FOMC Minutes Released: Markets will parse the minutes closely for signals on the Fed’s next move. Fed Chair Powell’s recent remarks that inflation expectations remain well anchored sparked a sharp reversal in rate expectations, with traders now pricing in modest rate cuts later in 2026 after briefly pricing in hikes.
- Thu, Apr 9 — Q4 2025 GDP Final Estimate: The third and final Q4 GDP reading gives the clearest picture of economic momentum heading into a turbulent 2026, and will inform how investors frame the stagflation vs. soft-landing debate.
- Thu, Apr 9 — February PCE Price Index: The Fed’s preferred inflation gauge is forecast to ease slightly to around 3.0%. As the last data point before the Iran conflict’s inflationary impact fully shows up in numbers, it serves as a key baseline for the Fed’s policy path.
The CNN Fear and Greed Index ends the week at Extreme Fear 15. This is the fourth week in row at the Extreme Fear level.
The Quant 30 and Quant Weekly Model Portfolios went from up 22% and 23% respectively to up 32% and 33%. An increase of 10 percentage points in one week.

Note: Choose between free and paid subscription levels. Paid subscribers enjoy instant access to weekly Portfolio updates upon release. Free subscribers access Portfolio updates after a three-week delay. Want timely access to the new Adds/Removes? Click here.
Model Portfolio Quant Alpha Weekly
Any newly added stock is being released to Paid Subscribers today. Below are the updates from three weeks ago. This Portfolio continues to significantly outperform its benchmark, 33% versus 14%.
No Adds to the Portfolio this week
PSIX received a hard sell from the Quant system and will be removed.
Add (03/13/26) :
Remove (03/13/26) : PSIX (Power Solutions)
Outperformers: SSRM (SSR Mining) up over 90%, MU (Micron Technology) up over 130%, VISN (Vistance Networks) up over +130%
Click here for the Quant Alpha Weekly details
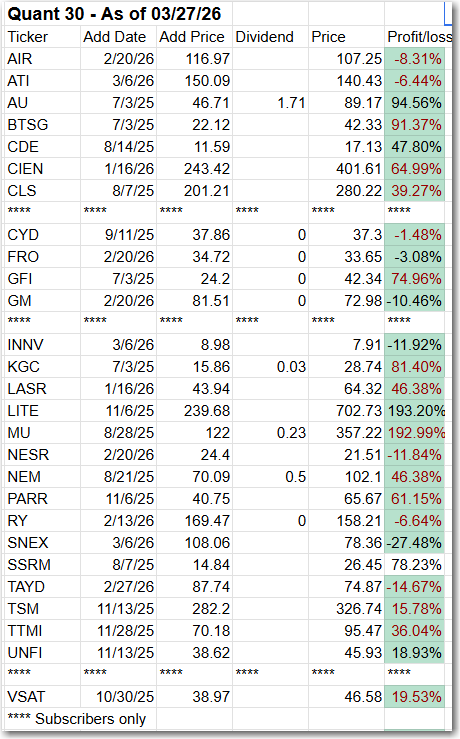
Model Portfolio Quant 30
This week’s new update, if any, is being released to the paid subscribers. Shown below is the update made three weeks ago. This Portfolio continues to beat its benchmark by a wide margin, 32% to 14%.
One Add to the Portfolio this week
Add (03/13/26): VICR (Vicor Corp) , ICHR (Ichor Holdings), CRDO (Credo Technology)
Remove (03/13/26): DB (Deutsche Bank), NUTX (Nutex Health), VFF (Village Farms)
Outperformers: MU (Micron Technology) up over 200%, GFI (Gold Fields) up over 90%, LITE (Lumentum Holdings) up over 240% and KGC (Kinross Gold) is up over 90%.
Click here for the Quant 30 details
Model Portfolio Quant Alpha’s – Legacy
The portfolio now has around 18 stocks in it. It is up over +270% since it began in 2023. Celestica in now a 11 bagger.
PSIX received a hard sell from the Quant system and will be removed.
Remove (03/13/26): PSIX (Power Solutions)
Outperformers: AGX (Argan) up over 700%, STRL (Sterling Infrastructure) up over 600%, POWL (Powell Industries) up over 900% and CLS (Celestica) is up over 1100%
Click here for the Quant Alpha’s – Legacy details

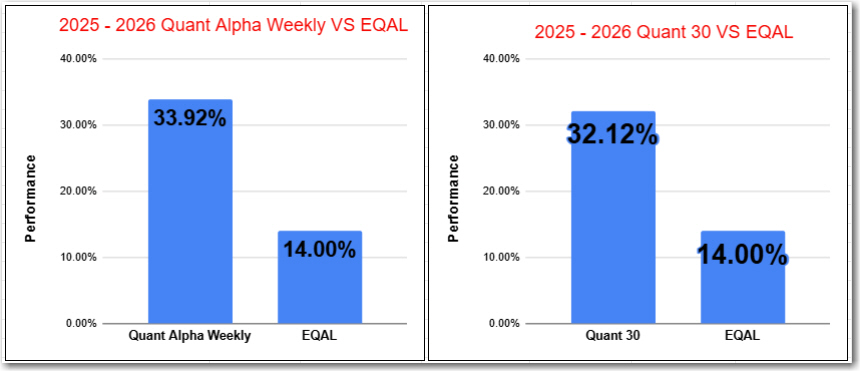
Performance to 04-03-2026
| Portfolio start date 6/27/25 | |
| Quant Alpha Weekly | 33.92% |
| EQAL (Russell 1000 Equal Weight ETF) | 14.00% |
| Portfolio start date 6/27/25 | |
| Quant 30 | 32.12% |
| EQAL (Russell 1000 Equal Weight ETF) | 14.00% |
| Portfolio start date 4/14/23 | |
| Quant Alpha’s – Legacy | 299.27% |
| EQAL (Russell 1000 Equal Weight ETF) | 37.76% |
Click here for the Live Quant scorecard

The Quant Alpha Weekly Portfolio remains ahead of its benchmark. Up over 33% since it began on June 27, 2025.
The Quant 30 Portfolio remains ahead of its benchmark. It is up 32% since it began on June 27, 2025.
The Quant Alpha’s – Legacy Portfolio maintained its over 270% return since April 2023, in a classic Position Trading Portfolio implementation.

When the CNN.COM Fear and Greed Index is four weeks at the Extreme Fear level, what is the performance of the S&P500 index in the 6 months following?
Where are we now on the CNN.COM Fear and Greed Index?
We have now been four weeks at the Extreme Fear reading. Here is a link to the Index chart from inception 2011-2012.
What “Extreme Fear” means on the CNN index
The CNN Fear & Greed Index scores from 0–100, with readings below 25 classified as “Extreme Fear.” Scores of under 25 are labeled “extreme fear,” with the index aggregating seven key indicators reflecting different aspects of market sentiment, including stock price momentum, price strength, put/call ratios, junk bond demand, volatility, and safe-haven demand.
Historical instances of sustained Extreme Fear and what followed
The episodes most comparable to four consecutive weeks of Extreme Fear are:
- March 2020 (COVID crash): The index remained in single-digit territory from March 5–23, a period when the S&P 500 lost more than 30% of its value. However, the S&P 500 then rallied by nearly 40% from its April lows — the last time the market was at extreme fear — before reaching new highs by autumn.
- April 2025 (Tariff shock): CNN’s Fear and Greed Index plunged to just 3 on April 8, its lowest level since March 2020. The two times in the past year when the index plunged into single digits were great buying opportunities — this happened in early April 2025, before stocks went on a great run until autumn, and again in late November, signaling another bottom with the market closing out the year strong.
What backtests say about buying during Extreme Fear
A backtest of 9,000+ trades across all CNN Fear & Greed decile ranges found that extreme fear requires patience and the willingness to endure continued volatility, while moderate fear (the 20–40 range) offers the best risk-adjusted returns for patient capital. Specifically, the 10–20 range shows solid performance at longer holds — +0.88% at 21 bars (about one month) with a 62.16% win rate — but the 20–40 zone is the clear champion for mean reversion plays over a 3–4 week timeframe.
The key nuance: buying during extreme fear works best with a long holding period, while selling during extreme greed just to wait for the next fear signal to buy is unreliable and can make you miss entire bull market rallies.
The academic picture
A peer-reviewed study found that the Fear and Greed Index Granger causes S&P 500 and Nasdaq Composite returns, though the relationship is considerably weaker in the 2021–2024 period than it was pre-2014. ScienceDirect In other words, the predictive signal from Extreme Fear has diminished somewhat over time.
The bottom line
There is no precise published statistic for exactly “4 weeks of Extreme Fear → 6-month S&P 500 return,” but the available evidence points in one direction: prolonged Extreme Fear has historically preceded strong 6-month recoveries, with the caveat that:
- The index doesn’t mark the exact bottom — fear can persist or deepen before reversing.
- The first signs of recovery usually emerge once the Fear and Greed Index climbs above 10, but a more reliable signal is a return above 25, which tends to precede sustainable rallies.
- The quality of the subsequent recovery depends heavily on whether the underlying macro trigger (pandemic, tariffs, a war) resolves.
In the two clearest modern analogues (March 2020 and April 2025), 6-month returns following multi-week Extreme Fear were strongly positive — roughly +30–40% from the bottom in both cases — but getting in at the exact trough required significant tolerance for short-term volatility.
Website Investment Educational Blog Posts –
All content on this site is for informational purposes only and does not constitute financial advice. Consult relevant financial professionals in your country of residence to get personalized advice before you make any trading or investing decisions. This post was written with the assistance of artificial intelligence. The original ideas and final review are human-generated. Disclaimer
Copyright 2023-2026 SwingTrader.Trading. All Rights Reserved.
