
Tag: HBI
-
Up 42% – Mid Cap Flyers Portfolio Changes – February 2025

The Mid Cap Flyers Model Portfolio has risen 42%, exceeding its benchmark, MDY, by 13%. Recently, 10 stocks were added and removed, now totaling 20. The portfolio primarily targets mid-cap stocks with market capitalizations between $1 billion and $12 billion. Backtests show strong historical performance, outperforming in 15 of 19 years.
-
Up 72% – BI-Weekly Swings Update – 11/21/2024
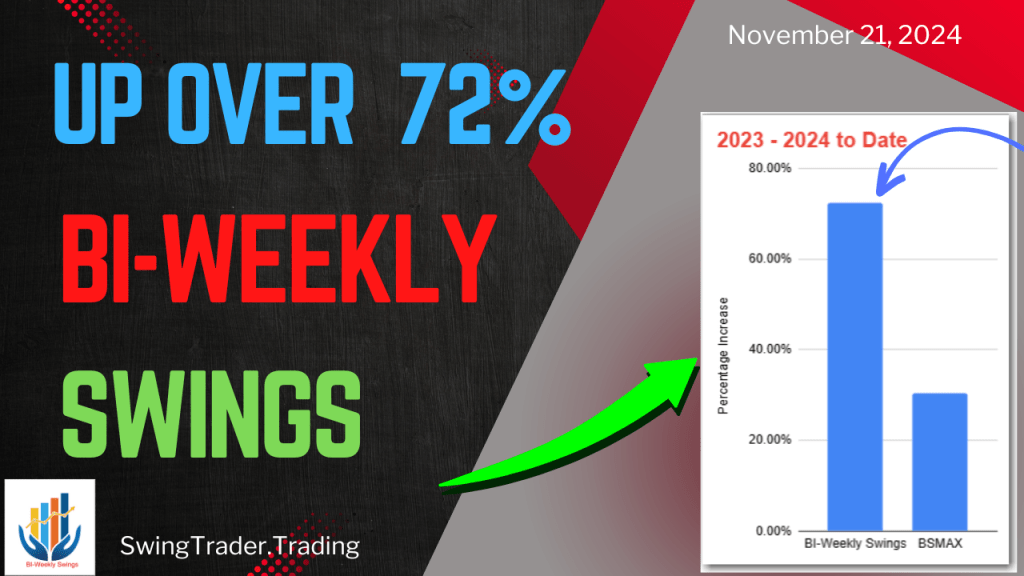
The Model Portfolio BI-Weekly Swings, updated on 11/21/2024, added and removed six stocks, maintaining a total of 21. It has achieved a remarkable 72% increase from 2023-2024, outperforming the BSMAX benchmark by 39%. The portfolio uses a blend of strategies focused on various stock caps and key financial metrics.
-
Mid Cap Flyers Portfolio Changes 06/07/2024

Mid Cap Flyers Monthly Update – now ahead of its benchmark.
-
BI-Weekly Swings Update 06/05/24 – Up 61% 2023-2024
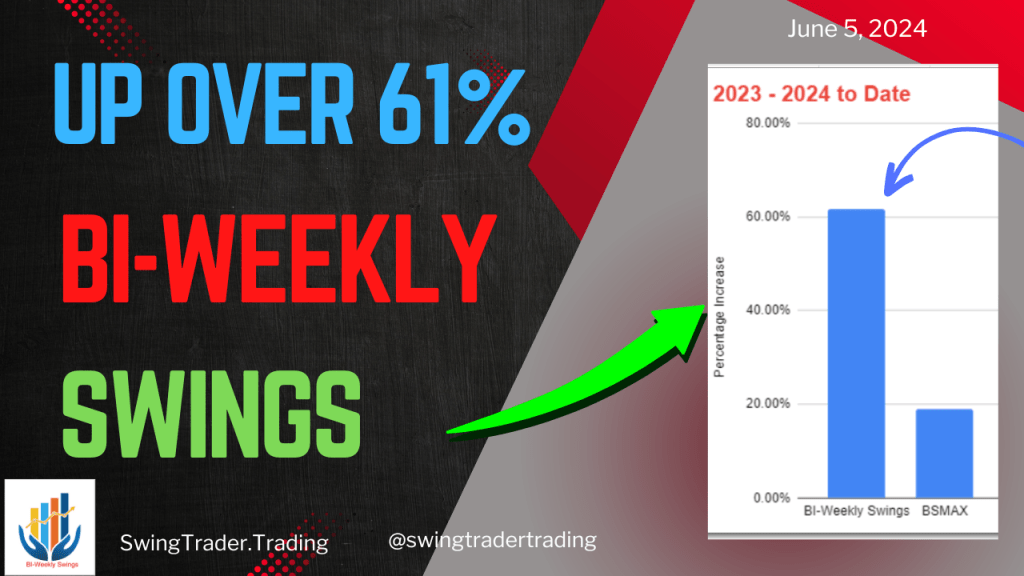
BI-Weekly Swings Portfolio has substantial outperformance for 2023.-2024.
