
- Quant 30 – Up over 43% since June 2025
- Quant Weekly – Up over 44% since June 2025
- Legacy – Up over 270% since April 2023
- Education – Is the “SaaS Apocalypse” a real threat to the future of USA software companies or is it a manufactured scare tactic to induce selling?
News alert – Middle East war outbreak: What would be the impact to the US economy if the Strait of Hormuz was closed for one week?
USA Stock market last week 02/27/26
Weekly returns across major U.S. indexes (approx):
- S&P 500: Down modestly — finished roughly -0.4% on the week.
- Dow Jones Industrial Average: Lower — down about -1.3% for the week.
- Nasdaq Composite: Lower — roughly -1.0% on the week.
- Russell 2000: Lower — around -1.2% for the week.
What this means:
The major U.S. benchmarks all finished the week in negative territory, with small caps (Russell 2000) and technology-heavy Nasdaq both declining alongside broad equities.
Takeaways
- Market direction: Weak week across the board — S&P 500, Nasdaq, Dow, and Russell 2000 all ended lower.
- Weakest segments: Technology and AI/Software-linked names, driven by rotation and profit expectations.
- More resilient areas: Energy, materials, and staples showed relative strength in context (YTD trend).
- Investor sentiment: Elevated fear and profit-taking signaled caution among traders.
Market Drivers This Week (03/02/26 – 03/06/26)
Tue, Mar 3 – Fed Officials Speeches (John Williams & Neel Kashkari)
• Fed commentary can shift expectations for future monetary policy, impacting interest-rate-sensitive sectors like tech and real estate.
Wed, Mar 4 – ADP Employment Report
• A mid-week jobs preview that often sets the tone for Friday’s broader nonfarm payrolls release. Employment data shapes rate outlook and equity momentum.
Wed, Mar 4 – ISM Services PMI & S&P Services PMI
• Services data provide insight on inflationary pressures and economic momentum, affecting consumer-oriented sectors and banks.
Fri, Mar 6 – U.S. Nonfarm Payrolls + Unemployment Rate + Wage Data
• The most market-sensitive release of the week. Strong jobs data can delay rate cuts and boost yields; weak data supports risk assets.
Earnings Reports Throughout the Week
• Late-season Q4 earnings continue, with major names like Target (TGT), Costco (COST), Broadcom (AVGO), Broadcom (AVGO), Best Buy (BBY) and others reporting — earnings surprises can drive sector rotation.
Bottom Line
The week is data-heavy and macro-focused, with jobs and PMI figures being the standout catalysts, Fed speeches shaping policy expectations, and corporate earnings continuing to influence sector leadership. Rising or falling yields and ongoing trade/geopolitical narratives will further amplify moves across stocks and sectors.
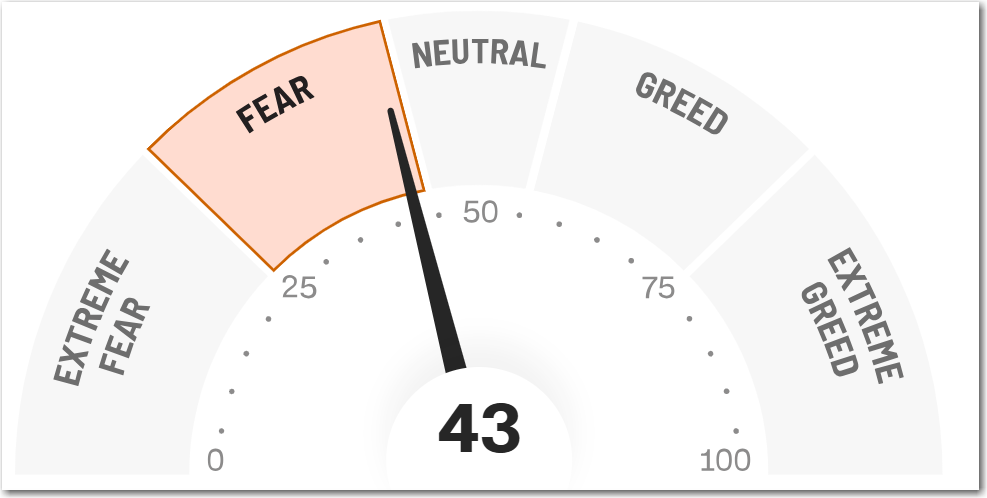
The CNN Fear and Greed Index ends the week at Fear 43.
The Quant 30 and Quant Weekly Model Portfolios closed the week at all-time highs for the third week in a row.

Note: Choose between free and paid subscription levels. Paid subscribers enjoy instant access to weekly Portfolio updates upon release. Free subscribers access identical content, with Portfolio updates published after a two-week waiting period. Want timely access to the new Adds/Removes? Click here.
Model Portfolio Quant Alpha Weekly
Any newly added stock is being released to Paid Subscribers today. Below are the updates from two weeks ago. This Portfolio continues to significantly outperform its benchmark, 44% versus 17%.
One Add to the Portfolio this week
Add (02/13/26) : CIEN (Ciena)
Remove (02/13/26): PQY (Pagaya Technologies)
Outperformers: CDE (Coeur Mining) up over 90%, MU (Micron Technology) up over 160%, VISN (Vistance Networks) up over +120%
Click here for the Quant Alpha Weekly details
Model Portfolio Quant 30
This week’s new update, if any, is being released to the paid subscribers. Shown below is the update made two weeks ago. This Portfolio continues to beat its benchmark by a wide margin, 43% to 17%.
One Add to the Portfolio this week
Add (02/13/26): RY (Royal Bank of Canada)
Remove (02/13/26): PQY (Pagaya Technologies)
Outperformers: MU (Micron Technology) up over 230%, GFI (Gold Fields) up over 140%, LITE (Lumentum Holdings) up over 190% and KGC (Kinross Gold) is up over 130%.
Click here for the Quant 30 details
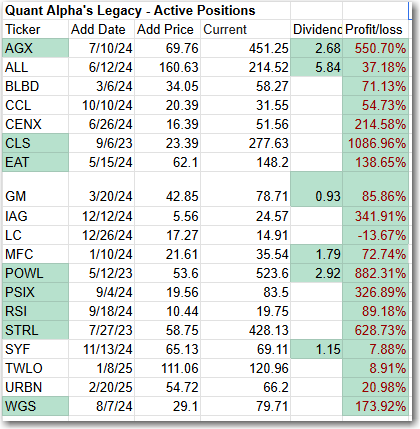
Model Portfolio Quant Alpha’s – Legacy
The portfolio now has around 19 stocks in it. It is up over +270% since it began in 2023. Celestica achieves a 10 bagger performance.
Remove (02/13/26): None
Outperformers: AGX (Argan) up over 500%, PSIX (Power Solutions)up over 300%, STRL (Sterling Infrastructure) up over 600%, POWL (Powell Industries) up over 800% and CLS (Celestica) is up over 1000%
Click here for the Quant Alpha’s – Legacy details

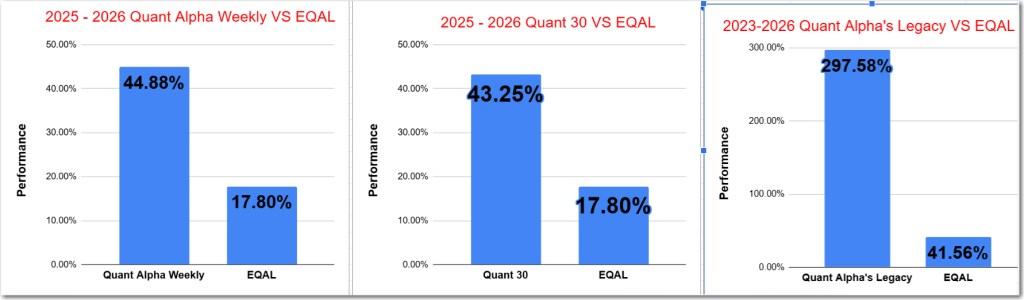
Performance to 02-27-2026
| Portfolio start date 6/27/25 | |
| Quant Alpha Weekly | 44.88% |
| EQAL (Russell 1000 Equal Weight ETF) | 17.80% |
| Portfolio start date 6/27/25 | |
| Quant 30 | 43.25% |
| EQAL (Russell 1000 Equal Weight ETF) | 17.80% |
| Portfolio start date 4/14/23 | |
| Quant Alpha’s – Legacy | 297.58% |
| EQAL (Russell 1000 Equal Weight ETF) | 41.56% |
Click here for the Live Quant scorecard

The Quant Alpha Weekly Portfolio remains ahead of its benchmark. Up over 44% since it began on June 27, 2025.
The Quant 30 Portfolio remains ahead of its benchmark. It is up 43% since it began on June 27, 2025.
The Quant Alpha’s – Legacy Portfolio maintained its over 270% return since April 2023, in a classic Position Trading Portfolio implementation.

Is the “SaaS Apocalypse” a real threat to the future of USA software companies or is it a manufactured scare tactic to induce selling?
The “SaaS Apocalypse” (or SaaSpocalypse) is a term that gained massive traction in early 2026, particularly after a brutal February where over $1 trillion in market value was wiped from software stocks.
Whether it is a “real threat” or a “manufactured scare” depends on which part of the software market you are looking at. It is best described as a structural evolution rather than a total extinction event.
Why it feels like a “Real Threat” (The Fundamentals)
The panic is rooted in four very real shifts that are breaking the traditional SaaS business model:
- The “Per-Seat” Model is Dying: For 20 years, SaaS grew by charging per user. But as AI agents begin doing the work of ten people, companies are slashing “seat counts,” causing revenue to crater for companies that haven’t shifted to usage-based pricing.
- Collapsing Creation Costs: “Vibe coding” and advanced AI agents (like Anthropic’s Claude Cowork) allow developers to build complex tools in hours that used to take months. This erodes the “moat” for simple, horizontal software like basic CRM or project management tools.
- Budget Cannibalization: Enterprise IT budgets aren’t growing much, but AI spending is up over 100% year-over-year. This money is being “harvested” directly from old SaaS subscriptions to pay for new AI infrastructure.
- The “Workflow Disruption”: Tools that automate entire workflows (like legal administration or expense tracking) are repricing entire sectors, making traditional software that just “organizes” data feel obsolete.
Why it feels like a “Scare Tactic” (The Market Reflex)
Many analysts, including those from JP Morgan and Wedbush’s Dan Ives, argue the sell-off has been “indiscriminate” and ignores the massive friction of changing enterprise software.
- The Governance Tax: While a startup can “vibe code” a new app in a weekend, it cannot easily replicate the security, compliance, and integration history of a giant like Salesforce or Workday.
- High Switching Costs: Enterprises are notoriously slow to change. Replacing a “System of Record” (where all a company’s data lives) is an operational nightmare that most CIOs will avoid unless the alternative is significantly better and cheaper.
- Integration over Extinction: Industry leaders like Nvidia’s Jensen Huang argue that AI will use existing software platforms as “tools” rather than replacing them.
The Verdict: Winners vs. Losers
| The “Losers” (High Risk) | The “Winners” (Resilient) |
| Horizontal “Point” Solutions: Apps that only do one simple thing (e.g., basic note-taking, simple dashboards). | Vertical/Domain Experts: Software that owns a complex, regulated niche like Healthcare (Epic) or Manufacturing. |
| Middle-tier “Seat” Sellers: Companies that refuse to move away from charging per human user. | Systems of Record: The companies that actually “own” the data (Microsoft, Oracle, Salesforce). |
| UI-only Apps: Software that is just a pretty interface on top of a public database. | Usage/Outcome Based: Companies that charge based on the work performed by their AI, not the number of people logged in. |
Which USA software stocks have been most impacted in 2026?
- Atlassian (TEAM): -51.45% YTD One of the primary victims of the “seat count” contraction narrative. As AI automates developer tasks, the market has heavily penalized Atlassian’s core workflow model.
- Workday (WDAY): -35.00% YTD Despite strong historical earnings, Workday faced massive selling pressure in February as investors feared a slowdown in HR and financial software spending in favor of AI infrastructure.
- UiPath (PATH): -34.11% YTD Formerly the darling of “Robotic Process Automation,” UiPath struggled to convince the market that its software wasn’t being commoditized by native AI agents from larger platform players.
- Unity Software (U): -34.12% YTD Suffered an early-year “diving” trend as the gaming and creative engine sector faced intense competition and a shift in how 3D assets are generated via AI.
- HubSpot (HUBS): -30.23% YTD The CRM mid-market leader saw significant valuation compression, trading nearly 68% below its 2025 highs by late February 2026.
- Salesforce (CRM): -23.19% YTD Even with aggressive AI messaging (Agentforce), the industry giant wasn’t immune. It saw a nearly 25% drop from its January peak as analysts lowered targets to reflect “valuation compression.”
- Snowflake (SNOW): -22.25% YTD A “double-edged sword” stock; while its product revenue grew 30%, its high valuation made it a prime target for the February drawdowns during the SaaS sell-off.
- Adobe (ADBE): -21.28% YTD Adobe faced “poor price momentum” throughout early 2026 as fears persisted that generative AI models could eventually erode its dominance in creative professional software.
- Digital Turbine (APPS): -15.80% YTD A smaller player that was swept up in the software breakdown, struggling to maintain its growth profile amidst the broader “SaaSpocalypse” sentiment.
- Twilio (TWLO): -12.55% YTD While it fared better than the high-growth “hyper-cloud” names, Twilio still underperformed the S&P 500 significantly as investors exited communication-API heavy stocks.
Website Investment Educational Blog Posts –
All content on this site is for informational purposes only and does not constitute financial advice. Consult relevant financial professionals in your country of residence to get personalized advice before you make any trading or investing decisions. This post was written with the assistance of artificial intelligence. The original ideas and final review are human-generated. Disclaimer
Copyright 2023-2026 SwingTrader.Trading. All Rights Reserved.

You must be logged in to post a comment.