

- Quant 30 – Up over 43% since June
- Quant Weekly – Up over 44% since June
- Legacy – Up over 270% since April 2023
- Updates to Quant Portfolios
USA Stock market last week 02/27/26
Weekly returns across major U.S. indexes (approx):
- S&P 500: Down modestly — finished roughly -0.4% on the week.
- Dow Jones Industrial Average: Lower — down about -1.3% for the week.
- Nasdaq Composite: Lower — roughly -1.0% on the week.
- Russell 2000: Lower — around -1.2% for the week.
What this means:
The major U.S. benchmarks all finished the week in negative territory, with small caps (Russell 2000) and technology-heavy Nasdaq both declining alongside broad equities.
Takeaways
- Market direction: Weak week across the board — S&P 500, Nasdaq, Dow, and Russell 2000 all ended lower.
- Weakest segments: Technology and AI/Software-linked names, driven by rotation and profit expectations.
- More resilient areas: Energy, materials, and staples showed relative strength in context (YTD trend).
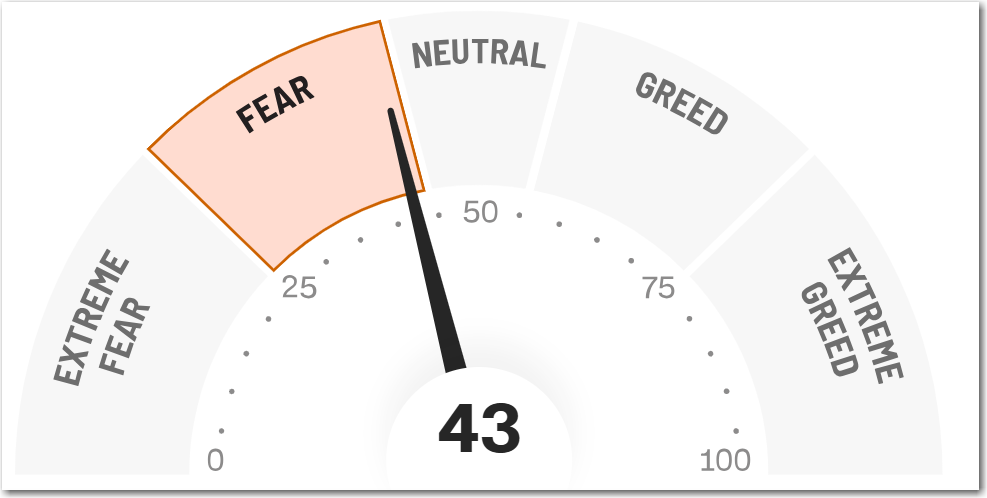
- Investor sentiment: Elevated fear and profit-taking signaled caution among traders.
Market Drivers This Week (03/02/26 – 03/06/26)
Tue, Mar 3 – Fed Officials Speeches (John Williams & Neel Kashkari)
• Fed commentary can shift expectations for future monetary policy, impacting interest-rate-sensitive sectors like tech and real estate.
Wed, Mar 4 – ADP Employment Report
• A mid-week jobs preview that often sets the tone for Friday’s broader nonfarm payrolls release. Employment data shapes rate outlook and equity momentum.
Wed, Mar 4 – ISM Services PMI & S&P Services PMI
• Services data provide insight on inflationary pressures and economic momentum, affecting consumer-oriented sectors and banks.
Fri, Mar 6 – U.S. Nonfarm Payrolls + Unemployment Rate + Wage Data
• The most market-sensitive release of the week. Strong jobs data can delay rate cuts and boost yields; weak data supports risk assets.
Earnings Reports Throughout the Week
• Late-season Q4 earnings continue, with major names like Target (TGT), Costco (COST), Broadcom (AVGO), Broadcom (AVGO), Best Buy (BBY) and others reporting — earnings surprises can drive sector rotation.
Bottom Line
The week is data-heavy and macro-focused, with jobs and PMI figures being the standout catalysts, Fed speeches shaping policy expectations, and corporate earnings continuing to influence sector leadership. Rising or falling yields and ongoing trade/geopolitical narratives will further amplify moves across stocks and sectors.
The CNN Fear and Greed Index ends the week at Fear 43.
The Quant 30 and Quant Weekly Model Portfolios closed the week at all-time highs for the third week in a row.

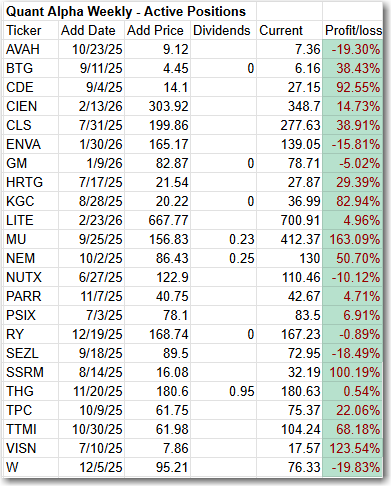
Model Portfolio Quant Alpha Weekly
No Adds for this update.
The 3 stocks with the highest Quant ranking in the Portfolio at this time are: MU, TTMI AND CDE.
Add: NONE
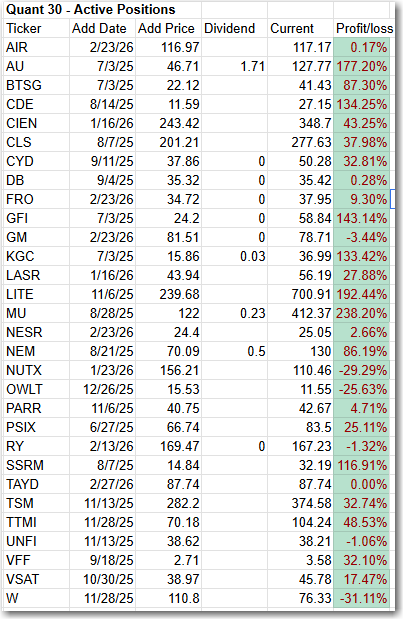
Model Portfolio Quant 30
One Add for this update.
The 3 stocks with the highest Quant ranking in the Portfolio at this time are: LITE, CDE, and MU.
Add: TAYD (Taylor Devices)
Remove: CCL (Carnival Cruise)
Model Portfolio Quant Alpha’s – Legacy
The portfolio now has 19 stocks in it. It is up over +270% since it began in 2023.
Remove: None
Click here for the Quant Alpha’s – Legacy details

Performance to 02-27-2026
| Portfolio start date 6/27/25 | |
| Quant Alpha Weekly | 44.88% |
| EQAL (Russell 1000 Equal Weight ETF) | 17.80% |
| Portfolio start date 6/27/25 | |
| Quant 30 | 43.25% |
| EQAL (Russell 1000 Equal Weight ETF) | 17.80% |
| Portfolio start date 4/14/23 | Live |
| Quant Alpha’s – Legacy | 297.58% |
| EQAL (Russell 1000 Equal Weight ETF) | 41.56% |
Click here for the Live Quant scorecard

The Quant Alpha Weekly Portfolio remains ahead of its benchmark. It is up over 44% since it began on June 27, 2025.
The Quant 30 Portfolio is currently up by 43%, well ahead of its benchmark.
The Quant Alpha’s – Legacy Portfolio maintained its over 270% return in a classic Position Trading Portfolio implementation.
All content on this site is for informational purposes only and does not constitute financial advice. Consult relevant financial professionals in your country of residence to get personalized advice before you make any trading or investing decisions. This post was written with the assistance of artificial intelligence. The original ideas and final review are human-generated. Disclaimer
Copyright 2023-2026 SwingTrader.Trading. All Rights Reserved.

You must be logged in to post a comment.