
- Quant 30 – Up over 26% since June 2025
- Quant Weekly – Up over 27% since June 2025
- Legacy – Up over 270% since April 2023
- Education – What is the best time of the day to buy USA stocks?
USA Stock market last week 03/06/26
Weekly returns across major U.S. indexes (approx):
- S&P 500: −2.0% for the week, closing near 6,740 on March 6.
- Dow Jones Industrial Average: −3.0% for the week, closing around 47,501.
- Nasdaq Composite: −1.2% for the week, closing near 22,387.
- Russell 2000: −4.1% for the week, underperforming large caps as risk appetite weakened.
Takeaways
- The week marked Wall Street’s worst performance in several months, driven by geopolitical risk, surging oil prices, and weakening economic data.
- Small-cap stocks lagged significantly, indicating a shift toward risk-off positioning by investors.
Market Drivers This Week (03/09/26 – 03/13/26)
- March 9 (Mon): Geopolitical Risk Carryover – Markets open the week cautious as investors continued reacting to escalating Middle East tensions and the prior week’s surge in oil prices, which raised concerns about inflation and global growth.
- March 10 (Tue): Small Business & Housing Data – The NFIB Small Business Optimism Index and existing home sales data give investors insight into the strength of the U.S. consumer and domestic economic momentum.
- March 11 (Wed): CPI Inflation Report – The Consumer Price Index (CPI) is the most important macro event of the week, heavily influencing expectations for Federal Reserve interest-rate policy.
- March 12 (Thu): Jobless Claims Data – Weekly initial unemployment claims are closely watched after the previous week’s surprisingly weak payroll report, which raised concerns about labor-market softness.
- March 12 (Thu): Trade Deficit & Housing Data – New data on the U.S. trade balance, housing starts, and building permits helps shape expectations for economic growth in Q1.
- March 13 (Fri): PCE Inflation Data – The Personal Consumption Expenditures (PCE) price index, the Federal Reserve’s preferred inflation gauge, is another major driver for interest-rate expectations.
- March 13 (Fri): GDP Revision & Durable Goods – Updated U.S. GDP estimates and durable goods orders provide further clues about the strength of business investment and economic momentum.
- Earnings Reports (Throughout the Week) – Corporate results from companies such as Adobe, Hewlett Packard Enterprise, Dollar General, and Ulta Beauty gave insight into AI spending, enterprise tech demand, and consumer health.
The CNN Fear and Greed Index ends the week at Fear 27. This makes four weeks in a row in the Fear area.
The Quant 30 and Quant Weekly Model Portfolios took a pounding this week as the market in general dropped with the momentum stocks leading the way down, as they always do. Since a middle east war has now been started and wars are unpredictable, it is unclear what the next few weeks will bring.

Note: Choose between free and paid subscription levels. Paid subscribers enjoy instant access to weekly Portfolio updates upon release. Free subscribers access identical content, with Portfolio updates published after a two-week waiting period. Starting next week, it will be three week delay for free subscribers. Want timely access to the new Adds/Removes? Click here.
Model Portfolio Quant Alpha Weekly
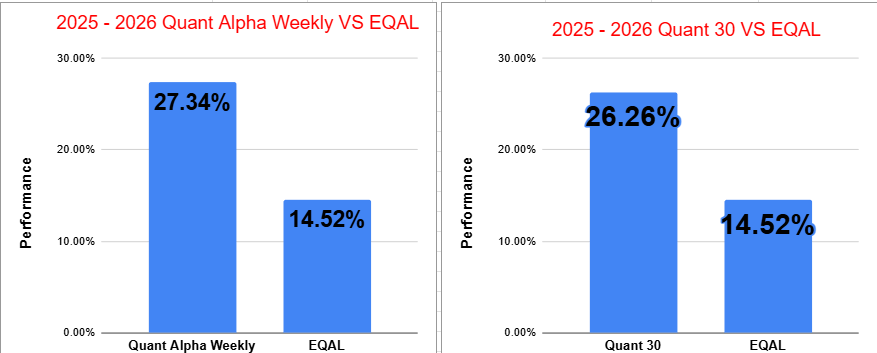
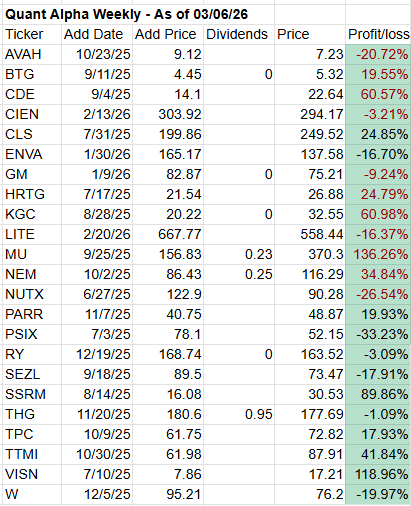
Any newly added stock is being released to Paid Subscribers today. Below are the updates from two weeks ago. This Portfolio continues to significantly outperform its benchmark, 27% versus 14%.
One Add to the Portfolio this week
Add (02/20/26) : LITE (Lumentum Holdings)
Remove (02/20/26): NONE
Outperformers: CDE (Coeur Mining) up over 60%, MU (Micron Technology) up over 130%, VISN (Vistance Networks) up over +110%
Click here for the Quant Alpha Weekly details
Model Portfolio Quant 30
This week’s new update, if any, is being released to the paid subscribers. Shown below is the update made two weeks ago. This Portfolio continues to beat its benchmark by a wide margin, 26% to 14%.
Three Adds to the Portfolio this week
Add (02/20/26): NESR (National Energy Services) , FRO (Frontline plc) , GM (General Motors) , AIR (AAR Corp)
Remove (02/20/26): SGHT (Sight Sciences) , HRTG (Heritage Insurance) , VISN (Vistance Networks), GH (Guardant Health)
Outperformers: MU (Micron Technology) up over 200%, GFI (Gold Fields) up over 100%, LITE (Lumentum Holdings) up over 130% and KGC (Kinross Gold) is up over 100%.
Click here for the Quant 30 details
Model Portfolio Quant Alpha’s – Legacy
The portfolio now has around 19 stocks in it. It is up over +270% since it began in 2023.
Remove (02/20/26): None
Outperformers: AGX (Argan) up over 400%, PSIX (Power Solutions)up over 100%, STRL (Sterling Infrastructure) up over 500%, POWL (Powell Industries) up over 800% and CLS (Celestica) is up over 900%
Click here for the Quant Alpha’s – Legacy details

Performance to 03-06-2026
| Portfolio start date 6/27/25 | |
| Quant Alpha Weekly | 27.34% |
| EQAL (Russell 1000 Equal Weight ETF) | 14.52% |
| Portfolio start date 6/27/25 | |
| Quant 30 | 26.26% |
| EQAL (Russell 1000 Equal Weight ETF) | 14.52% |
| Portfolio start date 4/14/23 | |
| Quant Alpha’s – Legacy | 271.83% |
| EQAL (Russell 1000 Equal Weight ETF) | 38.28% |
Click here for the Live Quant scorecard

The Quant Alpha Weekly Portfolio remains ahead of its benchmark. Up over 27% since it began on June 27, 2025.
The Quant 30 Portfolio remains ahead of its benchmark. It is up 26% since it began on June 27, 2025.
The Quant Alpha’s – Legacy Portfolio maintained its over 270% return since April 2023, in a classic Position Trading Portfolio implementation.


What is the best time of the day to buy USA stocks?
The Best Hour of the Day
- The Morning Rush (9:30 AM – 10:30 AM ET): This is the window of peak volatility. Overnight news and international market moves get priced in during the first hour.
- Best for: Experienced traders looking to capitalize on “gaps” (when a stock opens much lower/higher than it closed).
- The Midday Lull (11:30 AM – 2:00 PM ET): Often called the “lunchtime doldrums.” Volume drops, and price movements tend to flatten out.
- Best for: Beginners or long-term investors who want to avoid the “head fakes” and wild swings of the opening hour.
- The Power Hour (3:00 PM – 4:00 PM ET): Volume surges again as institutional investors and fund managers “square up” their positions before the close.
- Best for: Catching a trend that is likely to continue into the next day.
The Best Day of the Week
In the current 2026 market environment, the “Monday Effect” remains a popular theory, though it isn’t a guarantee:
- Monday Morning: Historically, Mondays have a reputation for being slightly “red” as investors digest negative news from the weekend. This can create a “buy the dip” opportunity.
- Friday Afternoon: Conversely, Fridays often see a “Friday Fade” or “Friday Rally” as traders decide whether they want to hold positions over the weekend. In 2026, with heightened geopolitical uncertainty (e.g., Greenland/Venezuela trade tensions), Fridays have seen more defensive selling.
The Best Strategy for Most People
If you aren’t a professional day trader, the “best time” is mathematically proven to be as soon as you have the money.
“Time in the market beats timing the market.”
Instead of waiting for 10:15 AM on a Tuesday, most successful investors in 2026 use Dollar Cost Averaging (DCA). This means buying a fixed amount at the same time every month (e.g., the 1st or 15th), regardless of the price.
| Goal | Recommended Time |
| Lowest Volatility | 12:00 PM – 1:30 PM ET |
| Highest Liquidity | 9:30 AM or 3:50 PM ET |
| Best Chance for “Dips” | Monday Mornings |
| Safest Entry | Anytime (via Dollar Cost Averaging) |
S&P 500 Performance by Weekday (10-Year Average)
| Day of the Week | Avg. Daily Return | Performance Characterization |
| Monday | +0.02% | The Most Volatile. Often handles “overnight” weekend news. Historically weak, but has flattened out recently. |
| Tuesday | +0.07% | The Growth Leader. Statistical outlier; often the day when “dip buyers” from Monday’s volatility enter the market. |
| Wednesday | +0.04% | The Midweek Pivot. Historically the “quietest” day unless a Federal Reserve (FOMC) announcement is scheduled. |
| Thursday | +0.03% | The Trend Setter. Often sees the start of position-squaring ahead of the weekend or major Friday data releases. |
| Friday | +0.05% | The “Feel Good” Day. Typically carries a positive bias as traders prefer not to go into the weekend on a “red” note. |
Key Insights from the Decade
- The “Tuesday Turnaround”: In the last 10 years, Tuesday has frequently outpaced all other days of the week combined in terms of annualized returns. This is often attributed to institutional investors placing orders after Monday’s data is fully digested.
- The Federal Reserve Factor: Because the Fed almost always releases its interest rate decisions on a Wednesday, that specific day accounts for the highest single-day volatility spikes of the year.
- Monday Volatility: Monday remains the day with the widest “range” (the difference between the high and low price). While its average return is lower, its potential for big swings is the highest due to the 48-hour accumulation of global news.
- Friday’s Reliability: Fridays have a high “win rate” (percentage of days closing positive), but the actual percentage gain is often capped by traders selling off to “lock in” profits before the weekend.
Website Investment Educational Blog Posts –
All content on this site is for informational purposes only and does not constitute financial advice. Consult relevant financial professionals in your country of residence to get personalized advice before you make any trading or investing decisions. This post was written with the assistance of artificial intelligence. The original ideas and final review are human-generated. Disclaimer
Copyright 2023-2026 SwingTrader.Trading. All Rights Reserved.

You must be logged in to post a comment.