

- Quant 30 – Up over 21% since June
- Quant Weekly – Up over 21% since June
- Legacy – Up over 270% since April 2023
- No Changes to the Quant Portfolios
USA Stock market last week 03/20/26
Major Index Performance (Weekly)
- S&P 500: -2.1% for the week, marking a fourth consecutive weekly decline.
- Dow Jones Industrial Average: -2.3% for the week as industrial and cyclical stocks weakened.
- Nasdaq Composite: -2.1% for the week, underperforming due to continued pressure on technology stocks.
- Russell 2000: -1.6% for the week, with small-caps hit hard and entering correction territory.
Takeaways
- Broad market declines across all major indexes
- Energy stocks outperforming sharply
- Technology and small-cap sectors leading losses
- Geopolitical and inflation pressures dominating market direction
Market Drivers This Week (03/23/26 – 03/27/26)
- Tue, Mar 24 – Richmond Fed Manufacturing Index
- This regional manufacturing gauge provided an early read on U.S. industrial activity and business sentiment following recent geopolitical disruptions.
- Tue, Mar 24 – Productivity & Unit Labor Cost Revisions
- Updated labor-cost data helped investors reassess inflation pressure from wages, a key variable for Federal Reserve policy.
- Wed, Mar 25 – Import & Export Price Index Data
- Trade price data offered insight into external inflation pressures and supply-chain cost trends affecting multinational companies.
- Wed, Mar 25 – 5-Year Treasury Note Auction
- Strong or weak demand for mid-duration Treasuries influenced the direction of yields and rate-sensitive sectors like technology and real estate.
- Thu, Mar 26 – 7-Year Treasury Note Auction
- A key event for the bond market; poor demand historically leads to yield spikes that can pressure equity valuations, especially growth stocks.
- Fri, Mar 27 – Final Q4 GDP Revision Released
- The government’s final estimate of fourth-quarter GDP gave investors a clearer picture of the economy’s underlying strength entering 2026.
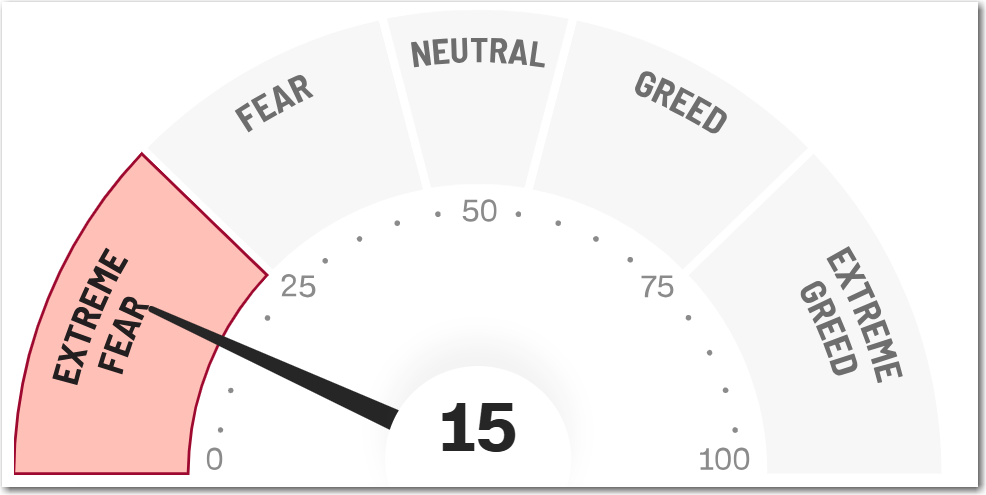
The CNN Fear and Greed Index ends the week at Extreme Fear 15. This makes two straight weeks at the Extreme Fear reading.
The Quant 30 and Quant Weekly Model Portfolios dropped a bit more following the general trend of the market.

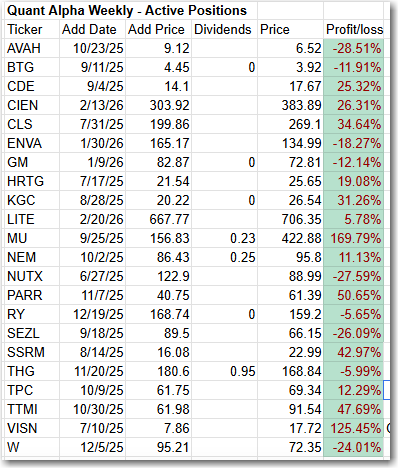
Model Portfolio Quant Alpha Weekly
No Adds for this update.
The 3 stocks with the highest Quant ranking in the Portfolio at this time are: MU, LITE AND TTMI.
Add: None
Model Portfolio Quant 30
No Adds for this update.
The 3 stocks with the highest Quant ranking in the Portfolio at this time are: LITE, VICR, and MU.
Add: None
Remove: None

Model Portfolio Quant Alpha’s – Legacy
The portfolio now has 18 stocks in it. It is up over +270% since it began in 2023.
Remove: None
Click here for the Quant Alpha’s – Legacy details

Performance to 03-20-2026
| Portfolio start date 6/27/25 | |
| Quant Alpha Weekly | 21.56% |
| EQAL (Russell 1000 Equal Weight ETF) | 10.79% |
| Portfolio start date 6/27/25 | |
| Quant 30 | 21.47% |
| EQAL (Russell 1000 Equal Weight ETF) | 10.79% |
| Portfolio start date 4/14/23 | |
| Quant Alpha’s – Legacy | 274.28% |
| EQAL (Russell 1000 Equal Weight ETF) | 34.55% |
Click here for the Live Quant scorecard

The Quant Alpha Weekly Portfolio remains ahead of its benchmark. It is up over 21% since it began on June 27, 2025.
The Quant 30 Portfolio is currently up by 21%, well ahead of its benchmark.
The Quant Alpha’s – Legacy Portfolio maintained its over 270% return in a classic Position Trading Portfolio implementation.
All content on this site is for informational purposes only and does not constitute financial advice. Consult relevant financial professionals in your country of residence to get personalized advice before you make any trading or investing decisions. This post was written with the assistance of artificial intelligence. The original ideas and final review are human-generated. Disclaimer
Copyright 2023-2026 SwingTrader.Trading. All Rights Reserved.

You must be logged in to post a comment.