
- Quant 30 – Up over 22% since June 2025
- Quant Weekly – Up over 23% since June 2025
- Legacy – Up over 270% since April 2023
- Education – How do USA oil and gas stocks perform in the six months after a major conflict ends?
USA Stock market last week 03/27/26
Major Index Performance (Weekly)
- S&P 500: -2.3% for the week, marking another weekly decline amid continued geopolitical uncertainty and rising energy prices.
- Dow Jones Industrial Average: -1.0% for the week, briefly entering correction territory after sharp late-week losses.
- Nasdaq Composite: -3.2% for the week as growth and technology shares remained under pressure.
- Russell 2000: +0.4% for the week, with small-caps showing some signs of life.
Takeaways
- Most major U.S. indexes declined again, extending the market’s losing streak.
- Energy and gold-related stocks were the main winners.
- Technology, consumer discretionary, and financials were the biggest laggards as inflation and geopolitical risks dominated investor focus.
Market Drivers This Week (03/30/26 – 04/03/26)
- Wed, Apr 1 – ISM Manufacturing PMI release
- The first business day of the month brings the ISM Manufacturing PMI, a key gauge of industrial momentum and an early signal of recession risk or resilience.
- Fri, Apr 3 – March Nonfarm Payrolls report
- The jobs report is the most anticipated macro catalyst of the week, shaping expectations for Fed policy and recession risk after signs of labor-market softening.
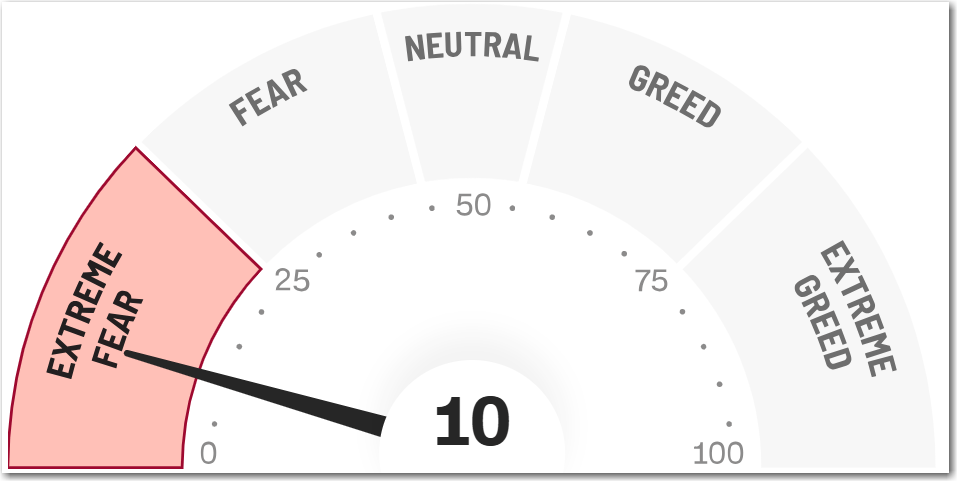
The CNN Fear and Greed Index ends the week at Extreme Fear 10. This is the third week in a row at the Extreme Fear level.
The Quant 30 and Quant Weekly Model Portfolios manage to generate small overall gains this week despite the major averages being solidly down.

Note: Choose between free and paid subscription levels. Paid subscribers enjoy instant access to weekly Portfolio updates upon release. Free subscribers access Portfolio updates after a three-week delay. Want timely access to the new Adds/Removes? Click here.
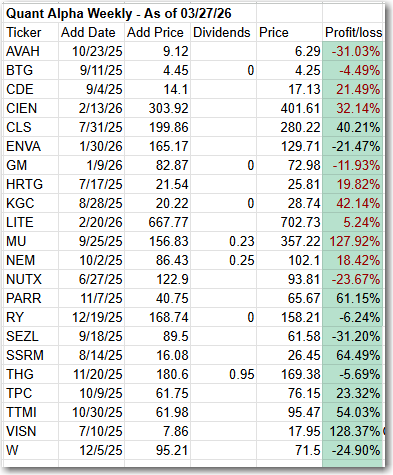
Model Portfolio Quant Alpha Weekly
Any newly added stock is being released to Paid Subscribers today. Below are the updates from three weeks ago. This Portfolio continues to significantly outperform its benchmark, 23% versus 11%.
No Adds to the Portfolio this week
Add (03/06/26) : None
Outperformers: SSRM (SSR Mining) up over 60%, MU (Micron Technology) up over 120%, VISN (Vistance Networks) up over +120%
Click here for the Quant Alpha Weekly details
Model Portfolio Quant 30
This week’s new update, if any, is being released to the paid subscribers. Shown below is the update made three weeks ago. This Portfolio continues to beat its benchmark by a wide margin, 22% to 11%.
One Add to the Portfolio this week
Add (03/06/26): INNV (InnovAge Holding), ATI (ATI), SNEX (StoneX Group)
Remove (03/06/26): PSIX (Power Solutions Int), W (WayFair), OWLT (Owlet)
Outperformers: MU (Micron Technology) up over 190%, GFI (Gold Fields) up over 70%, LITE (Lumentum Holdings) up over 190% and KGC (Kinross Gold) is up over 80%.
Click here for the Quant 30 details
Model Portfolio Quant Alpha’s – Legacy
The portfolio now has around 18 stocks in it. It is up over +270% since it began in 2023. Celestica in now a 10 bagger.
Remove (03/06/26): None
Outperformers: AGX (Argan) up over 700%, STRL (Sterling Infrastructure) up over 600%, POWL (Powell Industries) up over 900% and CLS (Celestica) is up over 1000%
Click here for the Quant Alpha’s – Legacy details

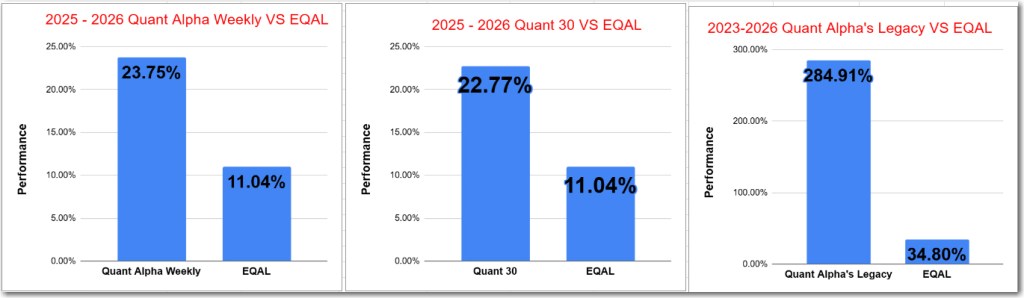
Performance to 03-27-2026
| Portfolio start date 6/27/25 | |
| Quant Alpha Weekly | 23.75% |
| EQAL (Russell 1000 Equal Weight ETF) | 11.04% |
| Portfolio start date 6/27/25 | |
| Quant 30 | 22.77% |
| EQAL (Russell 1000 Equal Weight ETF) | 11.04% |
| Portfolio start date 4/14/23 | |
| Quant Alpha’s – Legacy | 284.91% |
| EQAL (Russell 1000 Equal Weight ETF) | 34.80% |
Click here for the Live Quant scorecard

The Quant Alpha Weekly Portfolio remains ahead of its benchmark. Up over 23% since it began on June 27, 2025.
The Quant 30 Portfolio remains ahead of its benchmark. It is up 22% since it began on June 27, 2025.
The Quant Alpha’s – Legacy Portfolio maintained its over 270% return since April 2023, in a classic Position Trading Portfolio implementation.

How do USA oil and gas stocks perform in the six months after a major conflict ends?
Historical Pattern: “The Gulf War Syndrome”
The six-month period following major conflict resolutions shows a consistent pattern of oil price declines, often called “The Gulf War Syndrome.” This directly impacts oil and gas stock performance.
Gulf War I (1991)
Post-Conflict (Feb-Aug 1991):
- Oil prices fell steadily after the brief war ended in February 1991
- The six-month period after the first Gulf War was characterized by an “extremely weak oil market and falling prices”
- Oil prices continued declining through 1994, reaching their lowest level since 1973
- Energy stocks underperformed as prices fell from war-time peaks of $46/barrel to below $20/barrel
Iraq War (2003)
Immediate Post-Invasion (March-September 2003):
- Oil peaked at $40/barrel in early 2003, then fell after invasion
- Oil plunged 24% in the week after President Bush’s ultimatum on March 16
- However, oil markets in the six months prior to and during early 2003 Iraq War were “generally strong” compared to 1991
- Prices increased to more than $50/barrel by late 2003-2004 as spare production capacity dropped below 2 million barrels/day
- Oil stocks performed well due to structural supply constraints despite conflict ending
Mid-2003 to 2004:
- Energy sector showed resilience with prices climbing from $30s to $50+ range
- Spare OPEC capacity dropped from 6+ million barrels/day in mid-2002 to below 2 million in mid-2003
- Less than 1 million barrels/day spare capacity in 2004-2005 drove sustained higher prices
Libya Civil War (2011)
Post-U.S. Intervention (March-August 2011):
- Oil prices rose initially after U.S. intervention began March 19, 2011
- Prices peaked one month after start of U.S. action
- Oil then fell steadily, declining 24% by the time rebel forces gained control four months later
- Energy stocks tracked this decline through summer 2011
Recent Conflicts (2023-2026)
Israel-Hamas (Oct 2023 – Present):
- Most Middle East crises now follow predictable path: initial oil spike fears give way to supply normalization within 2 months
- Modern conflicts see faster normalization as supply chains adapt and strategic reserves deploy
- The 2023 conflict fits the pattern – “stocks up, oil down after 2 months”
Key Takeaways:
Typical Six-Month Pattern:
- Weeks 1-4: Sharp decline of 15-25% from war-time peaks as supply fears ease
- Months 2-4: Continued gradual decline as production normalizes
- Months 5-6: Stabilization at new lower price level
Exception Cases (where oil stayed elevated):
- Iraq War 2003-2005: Structural supply constraints kept prices rising despite conflict
- Afghanistan 2021-2022: Unrelated factors (COVID recovery, Russia-Ukraine buildup) supported prices
Oil Stock Performance:
- Energy stocks typically underperform broader market by 10-20% in six months post-conflict as prices normalize
- Exceptions occur when spare production capacity remains critically low (<2 million barrels/day)
- Modern conflicts (post-2010) show faster price normalization and smaller stock declines than historical conflicts
Top 10 USA Oil and Gas Stocks by Market Cap with 2026 YTD Performance and Dividend Yields:
| Rank | Company | Ticker | Market Cap | 2026 YTD Performance | Dividend Yield |
|---|---|---|---|---|---|
| 1 | ExxonMobil | XOM | $671B | +34% | 2.5% |
| 2 | Chevron | CVX | $410B | +35% | 3.5% |
| 3 | ConocoPhillips | COP | $155B | +36% | 2.6% |
| 4 | Williams Companies | WMB | $89B | +23% | 2.9% |
| 5 | Enterprise Products Partners | EPD | $82B | +20% | 5.8% |
| 6 | Marathon Petroleum | MPC | $68B | +43% | 1.6% |
| 7 | Kinder Morgan | KMI | $75B | +23% | 3.6% |
| 8 | Phillips 66 | PSX | $70B | +38% | 2.9% |
| 9 | EOG Resources | EOG | $75B | +34% | 2.9% |
| 10 | Occidental Petroleum | OXY | $59B | +47% | 1.7% |
Website Investment Educational Blog Posts –
All content on this site is for informational purposes only and does not constitute financial advice. Consult relevant financial professionals in your country of residence to get personalized advice before you make any trading or investing decisions. This post was written with the assistance of artificial intelligence. The original ideas and final review are human-generated. Disclaimer
Copyright 2023-2026 SwingTrader.Trading. All Rights Reserved.
