
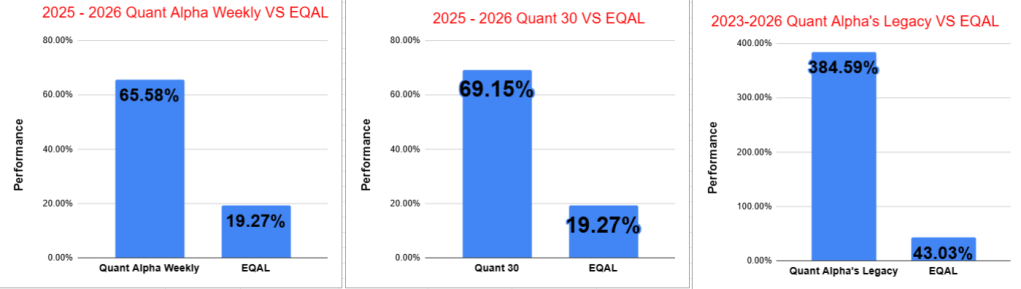
- Quant Weekly – Up over 65% since June 2025
- Quant 30 – Up over 69% since June 2025
- Legacy – Up over 380% since April 2023
- Education – When a stock announces a stock split, is there a good way to profit from this?
- Quick Links – At the bottom of the Post
USA Stock market week ending 05/22/26
Major Index Performance (Weekly)
- SPY (S&P 500 ETF): Finished the week up +1.0%, showing steady large-cap strength and maintaining positive momentum into the May 22 close.
- DIA (Dow Jones Industrial Average ETF): Gained +1.8%, leading the major indexes as industrial and blue-chip names outperformed during the week.
- ^IXIC (Nasdaq Composite): Rose +0.4%, posting more modest gains compared to the broader market while still closing the week in positive territory.
- IWM (Russell 2000 ETF): Advanced +2.7%, making it the strongest-performing major index of the group as small caps showed notable relative strength.
Takeaways
- Small caps led the market, with IWM significantly outperforming the major large-cap indexes.
- Blue-chip industrials remained strong, helping DIA post the second-best weekly performance.
Market Drivers this Week (05/25/26 – 05/29/26)
- Monday, 5/26 — U.S. Markets Closed
U.S. stock markets are closed for Memorial Day. No major earnings or economic reports are scheduled. - Tuesday, 5/27 — Consumer Confidence and Economic Data
The Consumer Confidence Index headlines the day alongside Durable Goods Orders and housing data. Earnings after the close include AutoZone (AZO) and Zscaler (ZS). - Wednesday, 5/28 — Major Tech and AI Earnings
Salesforce (CRM), Snowflake (SNOW), Marvell Technology (MRVL), and Synopsys (SNPS) report after the bell. Markets will also get the latest FOMC Minutes and MBA Mortgage Applications. - Thursday, 5/29 — GDP Revision and Key Retail Earnings
The second estimate for Q1 GDP, Weekly Jobless Claims, and Pending Home Sales are scheduled. Earnings include Dell (DELL), Costco (COST), Dollar Tree (DLTR), Best Buy (BBY), MongoDB (MDB), and Gap (GAP). - Friday, 5/30 — Core PCE Inflation Data
Core PCE and the broader PCE Price Index headline the week’s economic calendar. Personal Income, Personal Spending, Chicago PMI, and Consumer Sentiment data are also due before the open.
The CNN Fear and Greed Index ends the week at Greed 59. This is the sixth week in row at the Greed setting. This follows nine straight weeks at the Fear or Extreme Fear setting. Risk-on continues to be in the drivers seat and the market is reflecting this over the last six weeks.
The Quant 30 and Quant Weekly Model Portfolios all finished higher this week. Resuming their uptrend after suffering a loss last week. Before last week, they had been up seven weeks in a row.

Note: You are enjoying the free subscriber newsletter. Paid subscribers enjoy instant access to weekly Model Portfolio updates upon release and a Top Quant Stocks list. Free subscribers get access to Portfolio updates after a three-week delay but no Top Quant Stocks list. Want timely access to the new Adds/Removes and Top Quant Stocks list? Subscribe
Model Portfolio Quant Alpha Weekly
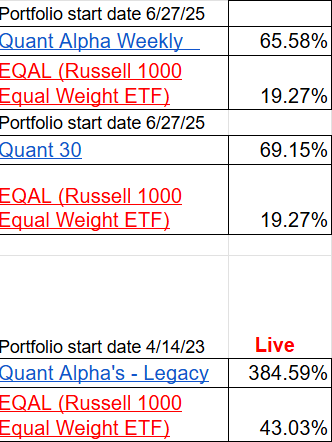
Any newly added stock is being released to Paid Subscribers today. Below are the updates from three weeks ago. This Portfolio continues to significantly outperform its benchmark, 65% versus 19%. It has 26 members.
Note: VISN (Vistance Networks) paid out a $10 per share dividend. Originally added to the Portfolio on 7/10/25 at $7.86 per share, it ended the week at $12.30. In addition, the company announced three weeks ago that it intends to sell part of the remaining company for $1.8 Billion. The transaction is expected to close within a few months. After this transaction only its Aurora Networks unit will be left. The current market cap of VISN is $2.8 Billion. It would be good bet that the remaining Aurora unit has a bright future as a fast growing small cap that is debt free.
MXL (MaxLinear) was added three weeks ago and is already up +28%. Paid subscribers were able to act. Free subscribers missed out.
Top five Quant stocks in the Portfolio (Paid subscribers only).
Add (05/01/26) : MXL (MaxLinear) – Semiconductors
Outperformers: SSRM (SSR Mining) up over +80%, MU (Micron Technology) up over +370%, VISN (Vistance Networks) up over +180%
Model Portfolio Quant 30
This week’s new update, if any, is being released to the paid subscribers. Shown below is the update made three weeks ago. This Portfolio continues to beat its benchmark by a wide margin, 69% to 19%. It has 30 members in it.
MXL (MaxLinear) was added three weeks ago and is already up +28%. Paid subscribers were able to act. Free subscribers missed out.
Top five Quant stocks in the Portfolio (Paid subscribers only).
Add (05/01/26): MXL (MaxLinear) – Semiconductors
Remove (05/01/26): ATI (ATI Inc)
Outperformers: MU (Micron Technology) up over +510%, LITE (Lumentum Holdings) up over +290%, TTMI (TTM Technologies) up over +170%, BTSG (BrightSpring Health) up over +160% and SNDK (Sandisk) up over +140%
Model Portfolio Quant Alpha’s – Legacy
The portfolio is up over +380% since it began in 2023. It has 18 stocks in it. Powell industries is now a 14 bagger. Celestica is now a 14 bagger and now Sterling Infrastructure has become a 11 bagger.
Top five Quant stocks in the Portfolio (Paid subscribers only).
Remove (05/01/26): None
Outperformers: AGX (Argan) up over +800%, STRL (Sterling Infrastructure) up over +1100%, POWL (Powell Industries) up over +1400% and CLS (Celestica) is up over +1400%
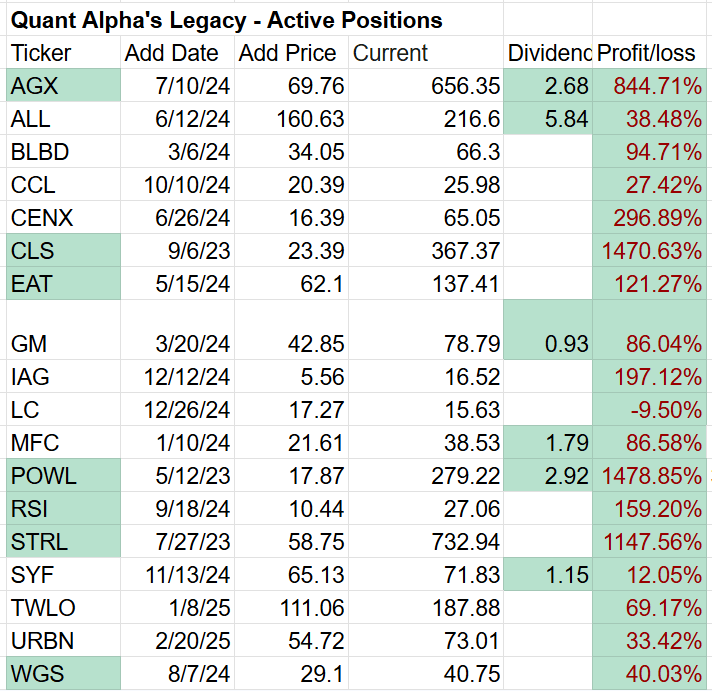

Performance to 05-22-2026
Top Quant Stocks for this week – (Paid subscribers only feature)

When a stock announces a stock split, is there a good way to profit from this?
Top 10 Pros of Trading Around a Stock Split
- Momentum often accelerates after the announcement
- Many split stocks continue trending higher into the effective split date.
- Traders and institutions frequently add exposure during the announcement-to-split window.
- Retail investor participation usually increases
- Lower post-split prices attract smaller investors psychologically.
- Increased retail buying can add short-term momentum.
- Stock splits often occur in elite growth companies
- Strong companies usually split after major earnings and price appreciation.
- Many historical market leaders announced multiple splits during long bull runs.
- Media attention rises significantly
- Financial media heavily covers major split announcements.
- Increased visibility can drive new buying interest.
- Liquidity improves after the split
- Higher share count can tighten spreads and improve trading activity.
- Options trading volume often increases as well.
- Institutional momentum may continue
- Funds often keep accumulating leading growth stocks after splits.
- Strong trends can persist well beyond the split event itself.
- Split announcements can reinforce bullish sentiment
- Investors often view splits as a sign of management confidence.
- Positive sentiment can attract trend-following capital.
- Options traders gain more flexibility
- Lower share prices can make options contracts more accessible.
- Increased options activity can amplify volatility and momentum.
- Technical setups often improve
- Breakouts and momentum patterns can strengthen after announcements.
- Strong relative strength frequently attracts technical traders.
- Historical data generally favors split stocks
- Many studies show split stocks outperforming the broader market over time.
- The strongest gains often occur before the actual split date.
Top 10 Cons of Trading Around a Stock Split
- The split itself creates no fundamental value
- Revenue, earnings, and cash flow remain unchanged after the split.
- Investors sometimes confuse lower share price with a cheaper valuation.
- “Buy the rumor, sell the news” risk is high
- Stocks often peak near the split execution date.
- Profit-taking can trigger sharp pullbacks afterward.
- Momentum traders can exit quickly
- Split rallies can reverse suddenly when hype fades.
- Short-term traders rarely stay committed during volatility.
- Valuations can become dangerously stretched
- Excitement can push stocks far beyond reasonable fundamentals.
- Overextended momentum often leads to large corrections later.
- Retail FOMO usually arrives late
- Many investors buy after most of the move already occurred.
- Chasing strength late often creates poor risk/reward setups.
- Volatility frequently increases
- Heavy options activity can create exaggerated price swings.
- Emotional trading tends to rise around split events.
- Not all split stocks continue outperforming
- Some split stocks significantly underperform after the event.
- Weakening earnings trends can quickly overpower split enthusiasm.
- Crowded trades become risky
- When everyone expects a rally, expectations can become excessive.
- Overcrowded momentum trades often unwind violently.
- Investors may ignore weakening fundamentals
- Split excitement can distract from slowing growth or margin pressure.
- Hype can temporarily mask operational problems.
- The strategy works best only in strong market environments
- Split momentum performs better during bullish market conditions.
- In weak markets, even strong split stocks can fail quickly.
Bottom Line
- The best way to profit from stock splits is usually focusing on fundamentally strong companies with accelerating earnings, institutional accumulation, and strong momentum before the crowd fully reacts.
- Historically, the strongest performance often occurs between the split announcement date and the actual split execution date, but risk management remains critical because split momentum can reverse sharply.
Is there a best time to get involved after the announcement?
Historically, the strongest performance period for many stock splits is actually the window between the split announcement date and the effective split date.
Studies over multiple decades have found that split stocks often gain approximately:
- 5% to 10% on average
between: - the announcement date
and - the actual split execution date.
Some high-momentum names have gained much more:
- NVIDIA
- Tesla
- Apple
Why This Period Often Performs Best
- Momentum traders pile in immediately
- Split announcements attract attention quickly.
- Retail investor excitement increases
- Many investors perceive the stock as becoming “more affordable.”
- Media coverage accelerates
- Financial news outlets heavily cover popular split announcements.
- Institutions often continue accumulating
- Strong companies usually announce splits during powerful uptrends.
- Options activity increases sharply
- This can amplify upside momentum temporarily.
What Historically Happens Most Often
Typical pattern:
- Strong stock already trending higher
- Split announced
- Stock rallies further into split date
- Momentum eventually cools after split execution
That’s why many traders focus on:
the announcement-to-split window, rather than buying after the split already occurred.
But There Are Important Risks
- Sometimes the move is already mostly priced in.
- Late buyers often chase extended momentum.
- Many split stocks experience:
- sharp pullbacks,
- profit-taking,
- or consolidation
after the split becomes effective.
This is especially true when:
- valuation becomes extreme,
- earnings slow,
- or the split hype exceeds fundamentals.
Historically Stronger Setups
The best-performing split trades usually combine:
- strong earnings growth,
- upward guidance revisions,
- institutional accumulation,
- and powerful sector momentum.
The split itself is usually:
a confirmation signal, not the actual reason the stock becomes a winner.
Bottom Line
The strongest gains typically occur when the split is accompanied by strong earnings momentum, institutional buying, and leadership within a powerful market theme.
Historically, stocks often perform best in the period between the split announcement and the actual split date.
Quick Links
- Live Scorecard
- Model Portfolio Quant Alpha Weekly
- Click here for the Quant Alpha Weekly details
- Model Portfolio Quant 30
- Click here for the Quant 30 details
- Model Portfolio Quant Alpha’s – Legacy
- Click here for the Quant Alpha’s – Legacy details
- Position Trader educational blog posts
- Position Trader – blog post user guide
All content on this site is for informational purposes only and does not constitute financial advice. Consult relevant financial professionals in your country of residence to get personalized advice before you make any trading or investing decisions. This post was written with the assistance of artificial intelligence. The original ideas and final review are human-generated. Disclaimer
Copyright 2023-2026 SwingTrader.Trading. All Rights Reserved.


You must be logged in to post a comment.