
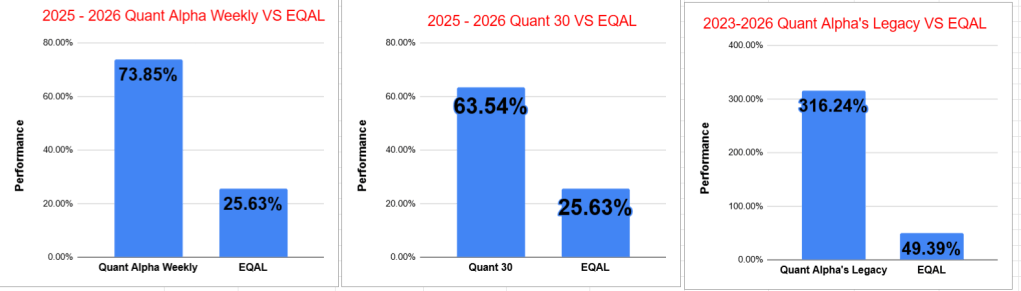
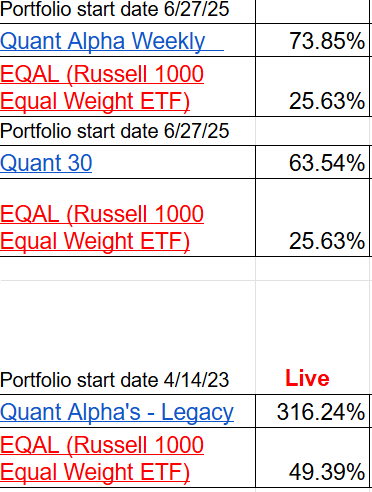
- Quant Weekly – Up over 73% since June 2025
- Quant 30 – Up over 63% since June 2025
- Legacy – Up over 310% since April 2023
- Education – What a $40 Trillion National Debt Could Mean for Your Wallet
USA Stock market week ending 08/28/26
- SPY — SPDR S&P 500 ETF Trust: +0.5% — The broad large-cap market finished modestly higher, helped by strong Nvidia earnings and AI optimism, although Friday’s gains reversed as Fed Chair Kevin Warsh’s Jackson Hole comments increased expectations for tighter monetary policy.
- ^IXIC — Nasdaq Composite Index: +0.8% — The Nasdaq outperformed the broader market as technology and software stocks rallied, with Nvidia’s strong earnings and outlook providing a major boost; however, higher Treasury yields and renewed rate-hike concerns pressured tech shares late in the week.
- DIA — SPDR Dow Jones Industrial Average ETF Trust: +0.3% — The Dow posted a smaller gain as strength in companies including Salesforce and other large-cap names helped offset weakness created by rising interest-rate expectations.
- IWM — iShares Russell 2000 ETF: -1.4% — Small caps significantly underperformed as higher Treasury yields and increased expectations for a September Fed rate hike pressured more interest-rate-sensitive companies; the underlying Russell 2000 fell about 1.5% for the week.
- SPMO — Invesco S&P 500 Momentum ETF: -1.3% — Momentum stocks struggled despite the broader Nasdaq gain, with SPMO hit by the Monday selloff and Friday’s technology reversal following Warsh’s comments; SPMO’s daily data shows a 1.74% decline Monday and another 1.22% decline Friday
Market Drivers this Week (08/31/26 – 09/04/26)
- Mon. 8/31: Global manufacturing data, including China’s August PMI, set the tone, while U.S. markets look ahead to a busy week of labor and economic releases.
- Tue. 9/1: JOLTS job openings for July arrive at 10:00 a.m. ET, while U.S. construction spending is also released. Earnings include Palo Alto Networks, MongoDB, Dell, Credo Technology and GitLab after the close.
- Wed. 9/2: ADP’s August employment report arrives, along with the ISM Beige Book and the Bank of Canada rate decision at 9:45 a.m. ET. Broadcom, Snowflake and Hewlett Packard Enterprise report earnings after the close.
- Thu. 9/3: A major data day: U.S. trade balance, weekly jobless claims, ISM Services PMI and revised Q2 productivity/costs are scheduled. Fed Governor Christopher Waller speaks at 8:30 a.m. ET, while earnings include Ciena, Zscaler, Samsara, DocuSign and UiPath.
- Fri. 9/4: The week’s biggest event is the August U.S. Employment Situation report at 8:30 a.m. ET, including nonfarm payrolls and the unemployment rate.
The CNN Fear and Greed Index ends the week at 54. Just barely dropping out of the Greed area into the Neutral area for the second week in a row. This is the fourth week in a row the index has been firmly out of the Fear area. The stock market remains choppy.
- 8/28/26 – 54 Neutral
- 8/21/26 – 55 Neutral
- 8/14/26 – 65 Greed
- 8/7/26 – 64 Greed
- 7/31/26 – 42 Fear
- 7/24/26 – 39 Fear
- 7/17/26 – 37 Fear
- 7/10/26 – 49 Neutral
- 7/3/26 – 32 Fear
- 6/26/26 – 25 Extreme Fear
The Quant Model Portfolios had a slightly down week. This is in keeping with momentum stocks as a whole having a slightly down week too. With the CNN Fear and Greed Index in Neutral for two weeks now, expecting a move up or down in the coming weeks. If the momentum stocks come back into favor, I expect the Portfolios will lead the way up.

Note: You are reading the free subscriber newsletter. Paid subscribers enjoy instant access to weekly Model Portfolio updates upon release. Free subscribers get access to Portfolio updates after a three-week delay. Want timely access to the new Adds/Removes? Subscribe
Model Portfolio Quant Alpha Weekly
Any newly added stock is being released to Paid Subscribers today. Below are the updates from three weeks ago. This Portfolio continues to significantly outperform its benchmark, 73% versus 25%. It has 28 members.
Top five Quant stocks in the Portfolio (Paid subscribers only).
Add (08/07/26) : ATI (ATI Inc) – Metal Fabrication
Outperformers: SSRM (SSR Mining) up over +130%, MU (Micron Technology) up over +490%, TTMI (TTM Technologies) up over +90%, PARR (Par Pacific Holdings) up over +90%
Model Portfolio Quant 30
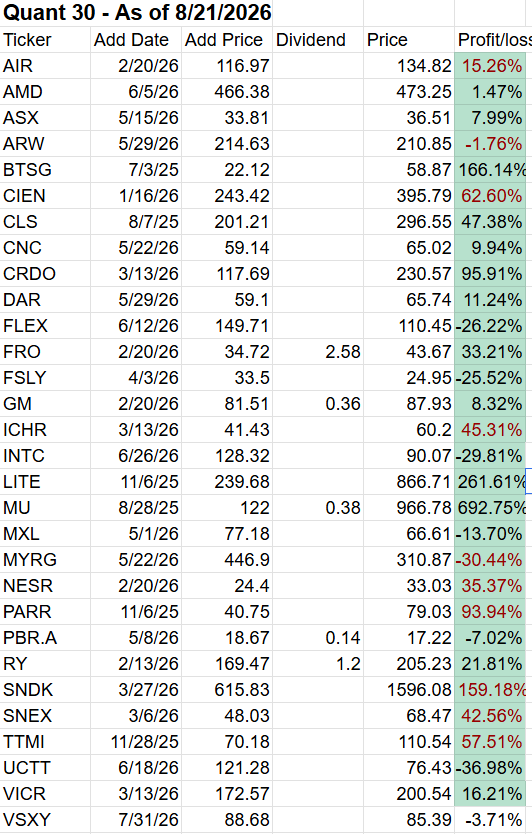
This week’s new update, if any, is being released to the paid subscribers. Shown below is the update made three weeks ago. This Portfolio continues to beat its benchmark by a wide margin, 63% to 25%. It has 30 members in it.
Top five Quant stocks in the Portfolio (Paid subscribers only).
Add (08/07/26): None
Remove (08/07/26): None
Outperformers: MU (Micron Technology) up over +600%, LITE (Lumentum Holdings) up over +270%, CRDO (Credo Technology) up over +90%, BTSG (BrightSpring Health) up over +160% and SNDK (Sandisk) up over +140%
Model Portfolio Quant Alpha’s – Legacy
The portfolio is up over +310% since it began in 2023. It has 17 stocks in it. Powell industries is now a 9 bagger. Celestica is now a 11 bagger
Top five Quant stocks in the Portfolio (Paid subscribers only).
Remove (08/07/26): None
Outperformers: AGX (Argan) up over +500%, STRL (Sterling Infrastructure) up over +700%, POWL (Powell Industries) up over +900% and CLS (Celestica) is up over +1100%
Model Portfolio Quant Top Stock
This new Portfolio adds one new stock a week. A separate email is sent on Thursday morning detailing the selection, a shallow dive on the pros and cons of the stock and the criteria used for the Portfolio.
Add: MPC (Marathon Petroleum) – Oil & Gas Refining & Marketing

Performance to 08-27-2026
Top Quant Stocks for this week – (Paid subscribers only feature)
Paid subscribers were presented with a list of the Top 10 Financials – Bank Stocks.
The last time the top 10 Financial – Bank stocks was revealed was 6/12/26. Since then the top 10 averaged a +5.7% increase. The ETF KBE (SPDR S&P Bank ETF) during the same time was up +2.8%.

What a $40 Trillion National Debt Could Mean for Your Wallet
The U.S. national debt is approaching $40 trillion, an almost unimaginable number. But the more important question isn’t the size of the number itself—it’s how rising debt and interest costs could eventually affect households, businesses and investors.
CBO’s February 2026 baseline projected a $1.9 trillion federal deficit for fiscal 2026 and federal debt held by the public rising from 101% of GDP in 2026 to 120% by 2036.
The Interest Bill Is the Big Problem
The government, like any borrower, has to pay interest on its debt. CBO projects net interest costs of about $1 trillion in 2026, rising to roughly $2.1 trillion by 2036.
That’s money that can’t simultaneously be used for other priorities such as infrastructure, defense, tax reductions or other government programs.
And the problem can compound: more debt + higher interest rates = greater interest expense, which can put additional pressure on future budgets.
What Could It Mean for Borrowing Costs?
Large government borrowing doesn’t automatically cause mortgage or auto-loan rates to rise dollar-for-dollar. Interest rates are influenced by many factors, including inflation, Federal Reserve policy, economic growth and investor demand for Treasury securities.
However, Treasury yields help establish a benchmark for borrowing throughout the economy. Persistently high government borrowing can contribute to upward pressure on longer-term interest rates, potentially making mortgages, business loans and other forms of credit more expensive.
The Deficit Matters as Much as the Debt
The debt is the accumulated result of past deficits, so the annual deficit is critical to understanding where the debt is headed.
CBO projects the federal deficit will grow from $1.9 trillion in 2026 to $3.1 trillion in 2036, with net interest costs rising from about $1.0 trillion to $2.1 trillion over the same period.
Under CBO’s baseline assumptions, debt held by the public reaches 120% of GDP in 2036, while gross federal debt reaches roughly $64 trillion.
Why Should Investors Care?
There isn’t universal agreement about exactly when high debt becomes a crisis. The United States has advantages that many other countries don’t, including the dollar’s international role, deep Treasury markets and a large, productive economy.
But the basic arithmetic isn’t controversial: rising debt means rising interest costs unless the government changes its spending, tax or borrowing trajectory.
And CBO’s projections show the pressure continuing beyond the next decade, with debt held by the public projected to reach 175% of GDP by 2056 under current law.
My View
I wouldn’t view $40 trillion of debt as an immediate reason to panic, but I would take the trend seriously. Rising interest costs can gradually squeeze the federal budget, potentially keep pressure on borrowing costs and eventually force difficult choices involving taxes and government spending.
For investors, the lesson is simple: don’t just watch the size of the debt—watch the cost of servicing it and whether economic growth can keep pace with the debt burden.

Quick Links
- Live Scorecard
- Model Portfolio Quant Alpha Weekly
- Click here for the Quant Alpha Weekly details
- Model Portfolio Quant 30
- Click here for the Quant 30 details
- Model Portfolio Quant Alpha’s – Legacy
- Click here for the Quant Alpha’s – Legacy details
- Position Trader educational blog posts
- Position Trader – blog post user guide
All content on this site is for informational purposes only and does not constitute financial advice. Consult relevant financial professionals in your country of residence to get personalized advice before you make any trading or investing decisions. This post was written with the assistance of artificial intelligence. The original ideas and final review are human-generated. Disclaimer
Copyright 2023-2026 SwingTrader.Trading. All Rights Reserved.


You must be logged in to post a comment.