
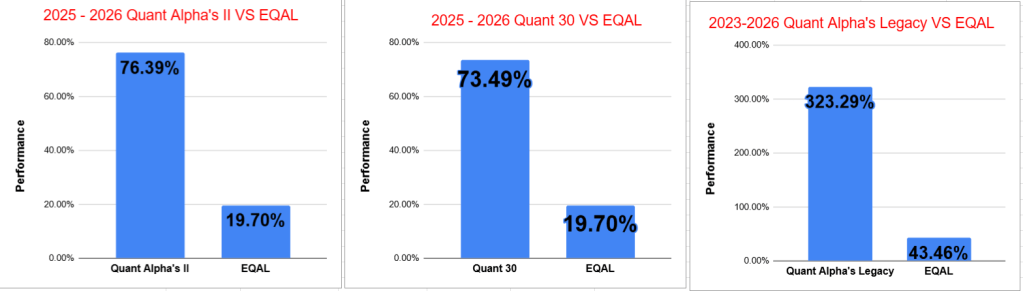
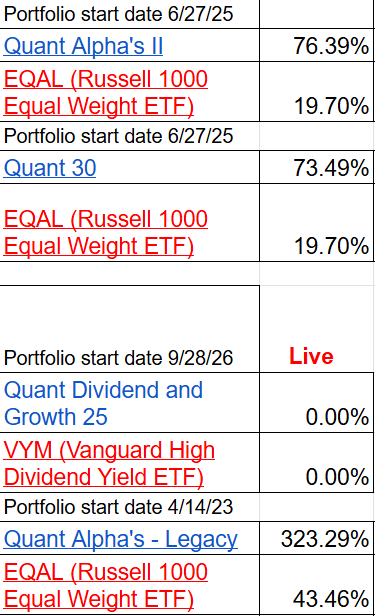
- Quant Alpha’s II – Up over 76% since June 2025
- Quant 30 – Up over 73% since June 2025
- Legacy – Up over 320% since April 2023
- Education – What Happens to Different Sectors When the Fed Raises Rates?
- New Quant Dividend and Growth 25 Model Portfolio to be launched September 28, 2026.
This week, a new “Quant Dividend and Growth 25” Model Portfolio will be added to the Quant lineup. It will be for Paid subscribers. This will be a Growth and Income type of portfolio. It will have 25 stocks in it and will be reviewed and updated as needed each week. Each stock in the portfolio will pay a dividend and be highly ranked in both the Quant Factors and the Quant Dividend metrics. A separate email was sent last Friday with the criteria for this new Model Portfolio.
USA Stock market week ending 09/18/26
- SPY (S&P 500): +1.3% — The S&P 500 posted a solid gain for the week from the close of September 21 through the close of September 25.
- ^IXIC (Nasdaq Composite): +2.1% — The Nasdaq outperformed the broader market, gaining 2.1% for the week.
- DIA (Dow Jones Industrial Average): +0.3% — The Dow posted a modest weekly gain of 0.3%.
- IWM (Russell 2000): -0.7% — Small-cap stocks declined 0.7%, lagging the major large-cap indexes.
- SPMO (Invesco S&P 500 Momentum ETF): +2.7% — Momentum stocks led the major benchmarks, with SPMO gaining 2.7% for the week.
Market Drivers this Week (09/21/26 – 09/25/26)
- Tuesday, 9/29 — Labor Market:JOLTS Job Openings for August is due at 10:00 AM ET, providing another look at labor-market demand ahead of Friday’s employment report.
- Wednesday, 9/30 — Q2 GDP Third Estimate and August Personal Income & Outlays, including the PCE price index, are scheduled for 8:30 AM ET. Micron (MU) reports fiscal Q4 results after the market close, making its outlook for AI-driven memory demand a key focus for investors.
- Thursday, 10/1 — ISM Manufacturing PMI for September and weekly initial jobless claims will provide fresh readings on economic and labor-market conditions.
- Friday, 10/2 — The September Employment Situation report, including nonfarm payrolls and the unemployment rate, arrives at 8:30 AM ET and will be the week’s major economic release.
The CNN Fear & Greed Index
The CNN Fear & Greed Index remained firmly in Fear territory, ending the week of September 25 at 37, up from 29 the previous week. Sentiment has stayed cautious for several weeks, with readings of 33 on 9/11, 42 on 9/4, and 54 on 8/28, after briefly reaching 65 (Greed) on 8/14 and 64 (Greed) on 8/7. Overall, the readings show a notable shift from Greed in mid-August to persistent Fear through September, suggesting investor sentiment has cooled considerably even as the stock market remains near elevated levels.
- 9/25/26 – 37 Fear
- 9/18/26 – 29 Fear
- 9/11/26 – 33 Fear
- 9/4/26 – 42 Fear
- 8/28/26 – 54 Neutral
- 8/21/26 – 55 Neutral
- 8/14/26 – 65 Greed
- 8/7/26 – 64 Greed
- 7/31/26 – 42 Fear
The Quant Model Portfolios had a good week. Quant Alpha’s II increased from +73% to +76%, Quant 30 increased from +70% to 73% and Quant Legacy increased from +318% to +323%. The addition of the new Quant Dividend and Growth 25 portfolio for paid subscribers expands coverage to the Growth and Income area of the market.

Note: You are reading the free subscriber newsletter. Paid subscribers enjoy instant access to weekly Model Portfolio updates upon release. Free subscribers get access to Portfolio updates after a four week or more delay. Want timely access to the new Adds/Removes? Subscribe
Model Portfolio Quant Alpha’s II
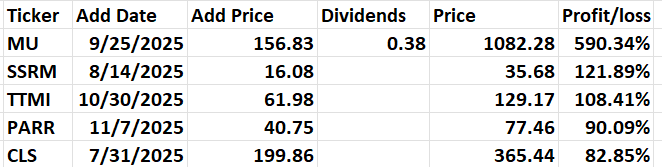
Any newly added stock is being released to Paid Subscribers today. This Portfolio continues to significantly outperform its benchmark, 76% versus 19%. It has 29 members.
Model Portfolio Quant 30
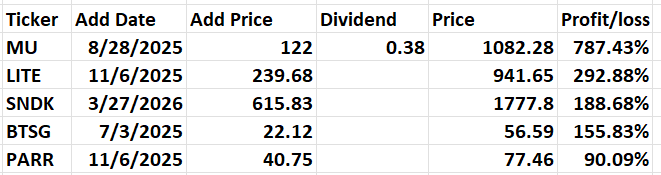
This week’s new update, if any, is being released to the paid subscribers. This Portfolio continues to beat its benchmark by a wide margin, 73% to 19%. It has 30 members in it.
Model Portfolio Dividend and Growth 25
Start date of September 28 for Paid Subscribers. The Quant scorecard will show the results along with the other Model Portfolios. A separate email was sent on September 25 detailing the criteria for this portfolio. A link to the criteria is below labeled “Model Portfolio Quant Dividend and Growth 25”.
Model Portfolio Quant Alpha’s – Legacy
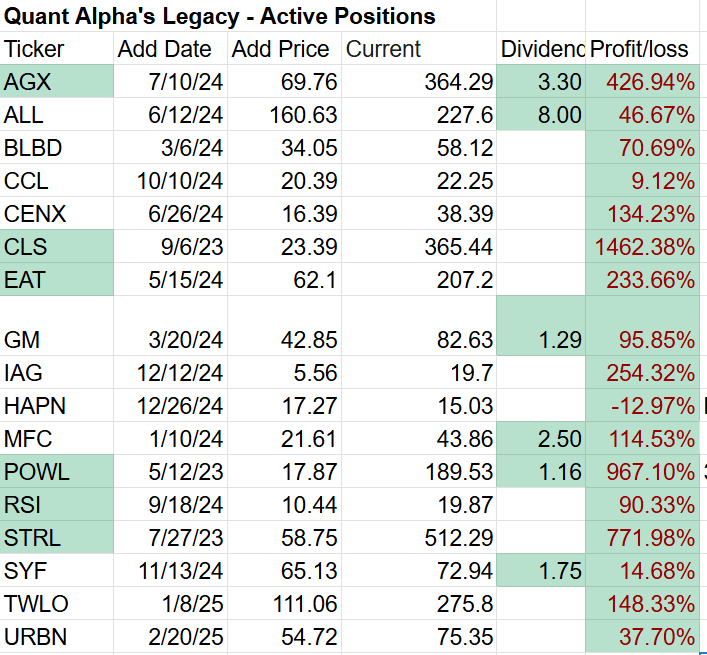
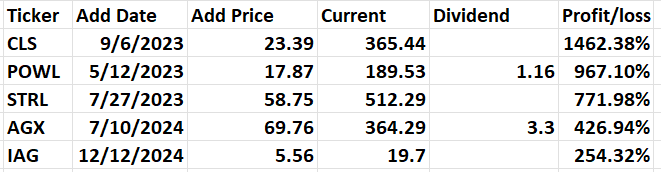
The portfolio is up over +320% since it began in 2023. It has 17 stocks in it. Powell industries is now a 9 bagger. Celestica is now a 14 bagger
Model Portfolio Quant Top Stocks
This new Portfolio adds one new stock a week. A separate email is sent on Thursday morning detailing the selection and a shallow dive on the pros and cons of the stock and the criteria used for the Portfolio.
This Model Portfolio will be converted to a permanent member of the lineup in the coming weeks. Stay tuned for updates.
This Model Portfolio will remain in the free newsletter.
Add: AMZN (Amazon.com) – Internet Retail

Performance to 09-25-2026

What Happens to Different Sectors When the Fed Raises Rates?
A Federal Reserve tightening cycle changes the financial environment for every company, but not in the same way. Higher short-term rates can pressure valuations and borrowing costs, while some businesses may benefit from stronger pricing, higher interest income, or favorable economic conditions.
History shows there is no universal “winner” or “loser” sector during rate-hiking cycles. Performance depends heavily on the reason for the hikes, the speed of tightening, economic growth, inflation, and what investors have already priced into stocks.
Financials: A Benefit That Is More Complicated Than It Looks
Banks can benefit from higher rates because yields on loans and other interest-earning assets can increase. But the Federal Reserve’s research shows that the impact on net interest margins (NIMs) is not automatically positive; deposit costs, loan competition, the yield curve, and funding mix all matter.
In fact, during several historical tightening cycles, aggregate bank NIMs were flat or declined modestly as funding costs rose and yield curves flattened.
Energy and Materials: More About Inflation and Demand
Energy and materials can benefit when rate hikes occur alongside strong commodity demand and elevated inflation. But these sectors are driven primarily by commodity prices, supply conditions and global economic activity, so their performance cannot be attributed to Fed policy alone.
The 2022 tightening cycle is a useful example of why this matters: the energy sector benefited from unusually strong commodity prices even as higher rates pressured many other parts of the equity market.
Quality Technology: Not All Tech Is the Same
Higher interest rates generally place greater pressure on stocks whose valuations depend heavily on earnings far in the future. But profitable technology companies with strong cash flow and large cash balances can be much less vulnerable than highly speculative, debt-dependent businesses.
The key distinction is valuation and balance-sheet quality, not simply whether a company is classified as “technology.”
Utilities: Higher Yields Create Competition
Utilities are often viewed as bond-like investments because investors value their relatively stable cash flows and dividends. When Treasury yields rise, those dividends can become less attractive relative to newly available government bond yields.
Federal Reserve materials from the 2004–2006 period show that utilities and REITs were among the interest-rate-sensitive areas that came under pressure when long-term yields rose.
Real Estate and REITs: Higher Financing Costs Matter
Real estate is particularly sensitive to interest rates because property values and investment returns are closely tied to financing costs and capitalization rates. Higher borrowing costs can also make refinancing more expensive.
Federal Reserve analysis has documented periods when higher long-term yields pressured REITs and other interest-rate-sensitive assets.
Unprofitable Growth: Usually the Most Rate-Sensitive
Companies with little or no current earnings can be especially sensitive to higher discount rates because much of their perceived value rests on cash flows expected years in the future. When discount rates increase, those future cash flows become less valuable in today’s dollars.
That doesn’t mean every growth stock falls during a tightening cycle, but high valuations combined with weak profitability can create a particularly fragile setup.
The Most Important Variable: Why the Fed Is Raising Rates
This may be the most important point for investors.
A gradual tightening cycle during a strong expansion is very different from an aggressive series of hikes designed to suppress persistent inflation. Federal Reserve research shows tightening cycles can produce very different financial conditions depending on their pace and economic backdrop.
The Fed’s historical work also found that stock prices initially reacted negatively around the 1994 and 2004 tightening episodes but subsequently stabilized and recovered as economic conditions improved.
The Takeaway
Rather than simply asking “Which sectors perform best when rates rise?”, investors should ask four questions:
How fast are rates rising?
Why are they rising?
How strong is economic growth?
How much of the rate increase is already priced into stocks?
The historical record suggests that financials can benefit but aren’t guaranteed winners; energy can benefit when commodity conditions are favorable; quality, cash-rich companies can be more resilient; while utilities, REITs and highly speculative growth stocks tend to face greater interest-rate sensitivity. Those are tendencies, not rules.

Quick Links
- Live Scorecard
- Model Portfolio Quant Alpha’s II
- Click here for the Quant Alpha’s II
- Model Portfolio Quant 30
- Click here for the Quant 30 details
- Model Portfolio Quant Dividend and Growth 25
- Model Portfolio Quant Top Stocks
- Model Portfolio Quant Alpha’s – Legacy
- Click here for the Quant Alpha’s – Legacy details
- Position Trader educational blog posts
- Position Trader – blog post user guide
All content on this site is for informational purposes only and does not constitute financial advice. Consult relevant financial professionals in your country of residence to get personalized advice before you make any trading or investing decisions. This post was written with the assistance of artificial intelligence. The original ideas and final review are human-generated. Disclaimer
Copyright 2023-2026 SwingTrader.Trading. All Rights Reserved.

