
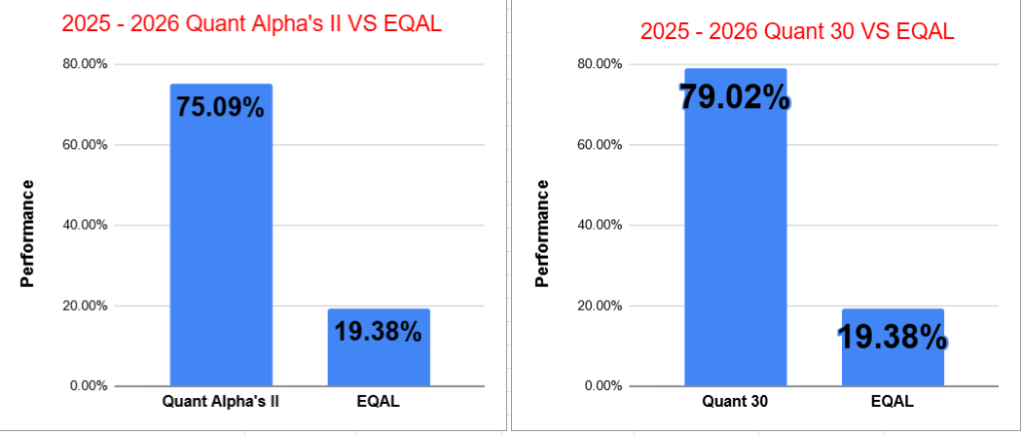
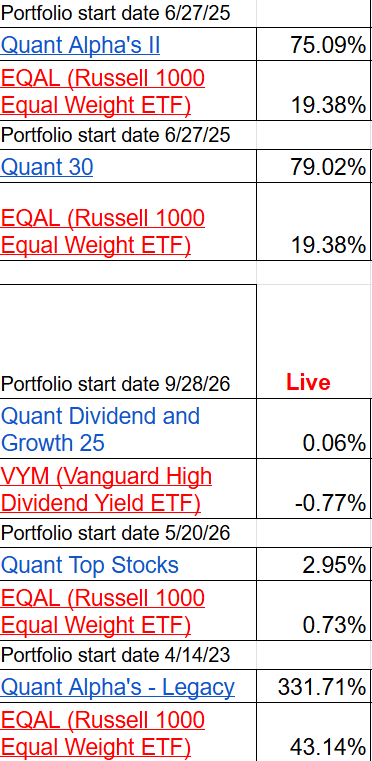
- Quant Alpha’s II – Up over 75% since June 2025
- Quant 30 – Up over 79% since June 2025
- Quant Alpha’s – Legacy – Up over 330% since April 2023
- Education – Rising Treasury Yields Raise Market Concerns
- New Quant Dividend and Growth 25 Model Portfolio started
- Quant Top Stocks Model Portfolio becomes permanent in the lineup.
- Quick Links
Last week, a new “Quant Dividend and Growth 25” Model Portfolio was added to the Quant lineup for Paid Subscribers. This will be a Growth and Income type of portfolio. It will have 25 stocks in it and will be reviewed and updated as needed each week.
This week, “Quant Top Stocks” will be made a permanent part of the Quant lineup. It will be tracked here each week. It’s details are available to all subscribers. A separate email is sent out each Thursday for this Portfolio.
USA Stock market week ending 10/02/26
- SPY (S&P 500 ETF): -0.2% — The S&P 500 finished the week slightly lower. ^IXIC (Nasdaq Composite): +0.5% — Technology and growth stocks helped the Nasdaq finish modestly higher.
- DIA (Dow Jones Industrial Average ETF): -1.2% — The Dow was the week’s weakest major index among those listed.
- IWM (Russell 2000 ETF): -0.2% — Small-cap stocks edged lower, matching SPY’s weekly decline.
- SPMO (Invesco S&P 500 Momentum ETF): +0.2% — Momentum stocks posted a modest weekly gain.
Market Drivers this Week (10/05/26 – 10/09/26)
- Monday, 10/5 — September ISM Services PMI and final S&P Global Services and Composite PMIs are released, providing an important update on the strength of the U.S. services economy.
- Tuesday, 10/6 — ADP weekly employment data and the August U.S. trade balance are scheduled, offering fresh readings on labor-market conditions and international trade.
- Wednesday, 10/7 — The FOMC minutes from the September 15–16 meeting are released at 2:00 PM ET, giving investors additional insight into officials’ views on inflation, employment and monetary policy ahead of the October 27–28 meeting.
- Thursday, 10/8 — Initial and continuing jobless claims and wholesale-trade data are released.
- Friday, 10/9 — Preliminary University of Michigan consumer sentiment and inflation expectations are released at 10:00 AM ET. Delta Air Lines (DAL) reports its September-quarter results before the market opens.
The CNN Fear & Greed Index
Investor sentiment has shifted noticeably toward caution over the past 10 weeks. The index reached Greed territory in early and mid-August, with readings of 64 and 65, before falling into Neutral at 54–55 later that month. By September, sentiment had moved firmly into Fear, with readings ranging from 29 to 42, and the latest reading of 31 on October 2 remains in the Fear zone. The progression from 65 in August to 31 currently represents a 34-point decline, indicating that investor sentiment has deteriorated substantially even though the stock market itself has not experienced a comparable collapse.
- 10/2/26 – 31 Fear
- 9/25/26 – 37 Fear
- 9/18/26 – 29 Fear
- 9/11/26 – 33 Fear
- 9/4/26 – 42 Fear
- 8/28/26 – 54 Neutral
- 8/21/26 – 55 Neutral
- 8/14/26 – 65 Greed
- 8/7/26 – 64 Greed
- 7/31/26 – 42 Fear
The Quant Model Portfolios had a good week. Quant Alpha’s II moved from +76% to +75%, Quant 30 increased from +73% to +79% and Quant Alpha’s – Legacy increased from +323% to +331%. The two new Quant Portfolios, Quant Dividend and Growth 25 and Quant Top Stocks started being tracked this week and both show an initial small gain.

Note: You are reading the free subscriber newsletter. Paid subscribers enjoy instant access to weekly Model Portfolio updates upon release. Free subscribers get access to Portfolio updates after a four week or more delay. Want timely access to the new Adds/Removes? Subscribe
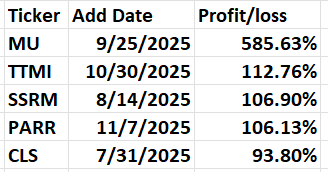
Model Portfolio Quant Alpha’s II
Any newly added stock is being released to Paid Subscribers today. This Portfolio continues to significantly outperform its benchmark, 75% versus 19%. It has 30 members.
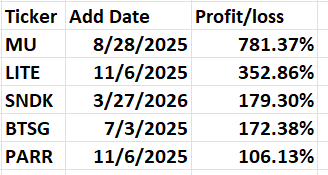
Model Portfolio Quant 30
This week’s new update, if any, is being released to the paid subscribers. This Portfolio continues to beat its benchmark by a wide margin, 79% to 19%. It has 30 members in it.
Model Portfolio Dividend and Growth 25
This week’s new update is being released to the paid subscribers. After the 1st week, the Portfolio is up +0.06% and the benchmark was down -0.77%. The 11 thru 20 members are being released to Paid Subscribers today.
Model Portfolio Quant Top Stocks
The portfolio is +2.95% with the benchmark +0.73%.
This Model Portfolio is converted to a permanent member of the lineup. It is now being tracked along with the other four Model Portfolios.
A Thursday morning post will update the Adds and Removals for this Portfolio.
Added Thursday: STX – Seagate Technology
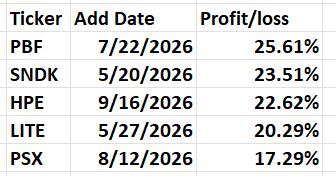
Model Portfolio Quant Alpha’s – Legacy
The portfolio is up over +330% since it began in 2023. It has 17 stocks in it. Powell industries is now a 10 bagger. Celestica is now a 15 bagger
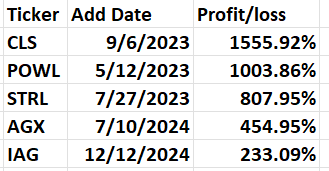

Performance to 10-02-2026

Rising Treasury Yields Raise Market Concerns
The 10-year Treasury yield has surged to levels not seen in years, but the speed of the move may be more important than the absolute level. The yield climbed above 5.17% on September 25, up sharply from below 4.8% just two weeks earlier and below 4.6% in August. Technical analyst John Roque of 22V Research has noted that previous periods of rapid increases in the 10-year yield were often followed by financial-market disruptions, although the causes and severity varied widely.
The 10-year Treasury is a key benchmark for borrowing costs across the economy, influencing everything from mortgages and corporate financing to financial-market valuations. A rapid rise in yields can put pressure on highly leveraged companies, banks and other risk assets, particularly when investors and businesses have positioned for more stable borrowing costs. Areas drawing attention include regional banks, utilities, homebuilders and highly leveraged investments, while some investors are also watching private credit and debt-funded AI infrastructure for potential vulnerabilities.
The key issue for investors is not simply that rates are high—it is how quickly they are rising and where the pressure may emerge next.
The areas of the economy most sensitive to a rapid rise in the 10-year Treasury yield are generally those that depend heavily on borrowing, refinancing, or long-duration cash flows:
- Housing & Homebuilders — Higher Treasury yields typically push mortgage rates higher, reducing affordability and potentially slowing home sales, construction and housing demand.
- Commercial Real Estate — Higher financing costs and capitalization rates can pressure property values, while refinancing maturing debt becomes more expensive. Office and highly leveraged properties can be particularly sensitive.
- Regional Banks — Banks can face pressure from higher funding costs, unrealized losses on securities and weaker loan demand. Rapid rate increases can be especially challenging if deposit costs rise quickly.
- Consumer Credit — Higher borrowing costs can squeeze households with variable-rate debt, including credit cards, auto loans and other consumer financing.
- Utilities — Utilities often carry significant debt because of their capital-intensive operations. Higher rates increase financing costs and can make their relatively high dividend yields less attractive compared with Treasury securities.
- High-valuation Growth Stocks — Companies whose expected cash flows are far in the future are particularly sensitive to higher discount rates, which can put pressure on valuation multiples.
- Debt-Funded AI Infrastructure — Large data-center and AI infrastructure projects requiring substantial debt financing could face higher costs and lower returns if Treasury yields remain elevated.
For investors, I’d put the biggest areas to watch in three buckets: housing/real estate, highly leveraged businesses and financial institutions, followed by long-duration/high-valuation stocks.
Quick Links
- Live Scorecard
- Quant Alpha’s II Criteria
- Quant Alpha’s II Stock List
- Quant 30 Criteria
- Quant 30 Stock List
- Quant Dividend and Growth 25 Criteria
- Quant Top Stocks Criteria
- Quant Top Stocks Stock List
- Quant Alpha’s – Legacy , Criteria
- Quant Alpha’s – Legacy , Stock List
- Position Trader educational blog posts
- Position Trader – blog post user guide
All content on this site is for informational purposes only and does not constitute financial advice. Consult relevant financial professionals in your country of residence to get personalized advice before you make any trading or investing decisions. This post was written with the assistance of artificial intelligence. The original ideas and final review are human-generated. Disclaimer
Copyright 2023-2026 SwingTrader.Trading. All Rights Reserved.

