
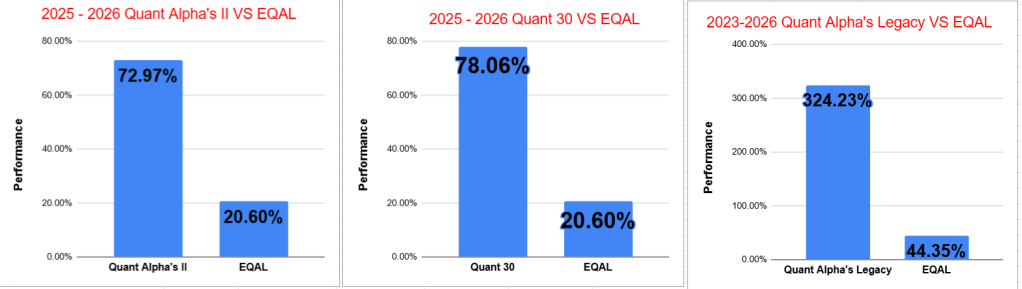
- Quant Alpha’s II – Up over 72% since June 2025
- Quant 30 – Up over 78% since June 2025
- Quant Alpha’s – Legacy – Up over 320% since April 2023
- Education – Midterm Elections and the Stock Market: What History Shows
- New Quant Dividend and Growth 25 Model Portfolio final 5 added
- Quick Links
USA Stock market week ending 10/09/26
- SPY (S&P 500): +1.2% — Large-cap stocks advanced solidly, leading the major indexes for the week.
- ^IXIC (Nasdaq Composite): +0.6% — Technology-heavy stocks posted a modest gain.
- DIA (Dow Jones Industrial Average): +0.1% — Blue-chip stocks were nearly unchanged for the week.
- IWM (Russell 2000): -1.0% — Small-cap stocks weakened, underperforming their large-cap counterparts.
- SPMO (S&P 500 Momentum ETF): -1.4% — Momentum stocks declined despite the broader market’s gains, signaling weakness among recent market leaders.
Market Drivers this Week (10/12/26 – 10/16/26)
- Monday, 10/12 — Columbus Day. U.S. stock markets remain open, but bond markets are closed.
- Tuesday, 10/13 — The NFIB Small Business Optimism Index is due at 6:00 a.m. ET, while JPMorgan Chase, Goldman Sachs, Citigroup and Wells Fargo report third-quarter earnings.
- Wednesday, 10/14 — The Consumer Price Index and Real Earnings reports arrive at 8:30 a.m. ET, followed by the Fed’s Beige Book at 2:00 p.m. Bank of America and Morgan Stanley also report earnings.
- Thursday, 10/15 — September PPI, September retail sales, weekly jobless claims and the Philadelphia Fed Manufacturing Index are scheduled for 8:30 a.m. ET.
The CNN Fear & Greed Index
The CNN Fear & Greed Index showed a notable improvement in investor sentiment during the latest week, rising to 45 (Neutral) on October 9, up from 31 (Fear) on October 2. This marks a shift away from the persistent fear that dominated September and early October, when readings ranged from 29 to 42, following Greed readings of 64 and 65 in early and mid-August. Sentiment gradually deteriorated through late August and September before rebounding over the past week, suggesting that investor anxiety may be easing. However, the index remains well below its August highs, indicating that confidence has not fully recovered.
- 10/9/26 – 45 Neutral
- 10/2/26 – 31 Fear
- 9/25/26 – 37 Fear
- 9/18/26 – 29 Fear
- 9/11/26 – 33 Fear
- 9/4/26 – 42 Fear
- 8/28/26 – 54 Neutral
- 8/21/26 – 55 Neutral
- 8/14/26 – 65 Greed
- 8/7/26 – 64 Greed
The Quant Model Portfolios had an off week with the SPMO (S&P 500 Momentum ETF) sliding -1.4%. The Portfolios remain full of highly ranked stocks in the Quant universe and when Risk On becomes dominant again, I expect the Portfolios will lead the way up.

Note: You are reading the free subscriber newsletter. Paid subscribers enjoy instant access to weekly Model Portfolio updates upon release. Free subscribers get access to Portfolio updates after a four week or more delay. Want timely access to the new Adds/Removes? Subscribe
Model Portfolio Quant Alpha’s II
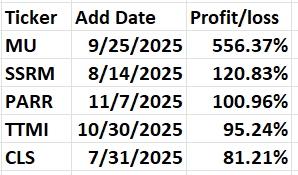
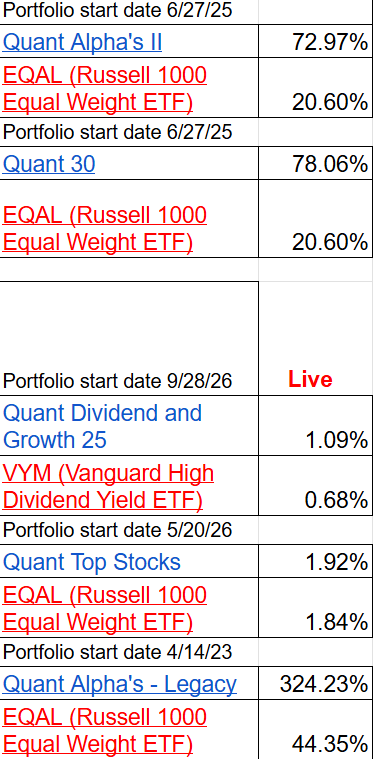
This week’s new update, if any, is being released to the paid subscribers. This Portfolio continues to significantly outperform its benchmark, 72% versus 19%. It has 30 members.
Model Portfolio Quant 30
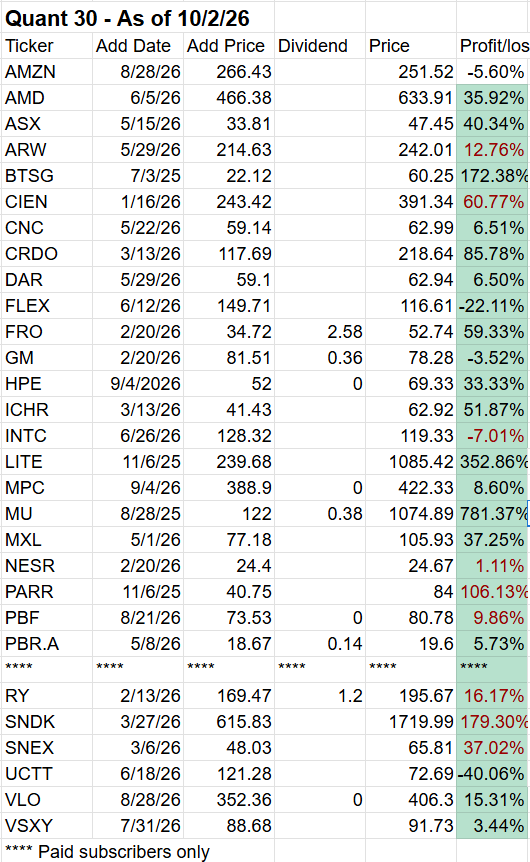
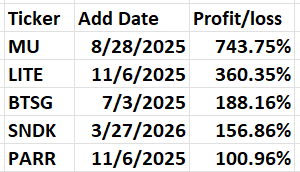
This week’s new update, if any, is being released to the paid subscribers. This Portfolio continues to beat its benchmark by a wide margin, 78% to 19%. It has 30 members in it.
Model Portfolio Dividend and Growth 25
This week’s new update is being released to the paid subscribers. The Portfolio is up +1.09% and the benchmark was up +0.68%. The 21 thru 25 members are being released to Paid Subscribers today.
Model Portfolio Quant Top Stocks
The portfolio is +1.92% with the benchmark +1.84%.
A Thursday morning post will update the Adds and Removals for this Portfolio.
Added Thursday: VLO (Valero Energy)
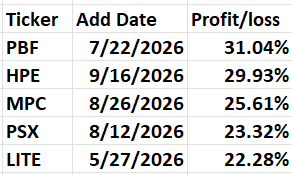
Model Portfolio Quant Alpha’s – Legacy
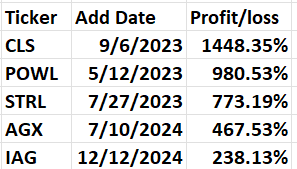
The portfolio is up over +320% since it began in 2023. It has 17 stocks in it. Powell industries is now a 9 bagger. Celestica is now a 14 bagger

Performance to 10-09-2026

Midterm Elections and the Stock Market: What History Shows
Historical data suggests that U.S. stocks have generally performed well following midterm elections, regardless of which party gains or loses control.
Strong Post-Midterm Performance
Since 1950, the S&P 500 has risen in all 19 twelve-month periods following midterm elections—an unusually consistent historical record that spans recessions, wars, oil shocks and financial crises. Looking further back to 1938, the index has gained in roughly 95% of the 12-month periods following midterm elections, while the S&P 500 has historically averaged about a 6.3% gain during the first three months following a midterm election.
Divided Government Has Often Been Market-Friendly
Markets have sometimes viewed divided government favorably because political gridlock can make sweeping tax increases, regulatory changes and major spending initiatives more difficult to implement. Historically, the S&P 500 has often produced stronger median returns under certain forms of divided government, although research on the relationship between political control and stock returns is mixed. In fact, some academic studies have found that unified governments have produced higher excess stock returns than divided governments, challenging the simple idea that “gridlock is always good for stocks.”
Not All Political Outcomes Perform the Same
The historical record also suggests that the specific combination of political control matters. For example, periods featuring a Republican president and full Democratic control of Congress have historically produced somewhat weaker short-term S&P 500 returns than the broader post-midterm average. However, these differences are relatively small compared with the many other factors influencing stock prices.
The Bigger Drivers Are Usually Economic
Investors should be cautious about attributing market performance directly to election results. Inflation, Federal Reserve policy, interest rates, economic growth, energy prices and recession risks have historically played a much larger role in determining market performance than which party controls Congress or the White House.
Bottom Line for Investors
The historical message is encouraging: the stock market has generally performed well during the year following midterm elections, including periods when government became divided. However, the data represents historical correlation—not a dependable forecasting tool. Investors should focus less on predicting the political outcome and more on the economic and market conditions that ultimately drive corporate earnings and stock valuations.
Quick Links
- Live Scorecard
- Model Portfolio Quant Alpha’s II
- Click here for the Quant Alpha’s II details
- Model Portfolio Quant 30
- Click here for the Quant 30 details
- Model Portfolio Quant Dividend and Growth 25
- Model Portfolio Quant Top Stocks
- Click here for the Quant Top Stocks details
- Model Portfolio Quant Alpha’s – Legacy
- Click here for the Quant Alpha’s – Legacy details
- Position Trader educational blog posts
- Position Trader – blog post user guide
All content on this site is for informational purposes only and does not constitute financial advice. Consult relevant financial professionals in your country of residence to get personalized advice before you make any trading or investing decisions. This post was written with the assistance of artificial intelligence. The original ideas and final review are human-generated. Disclaimer
Copyright 2023-2026 SwingTrader.Trading. All Rights Reserved.

