
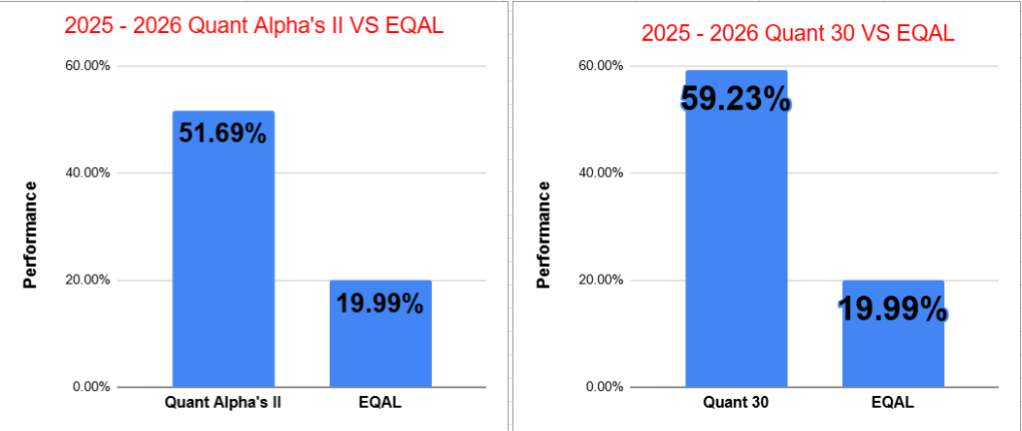
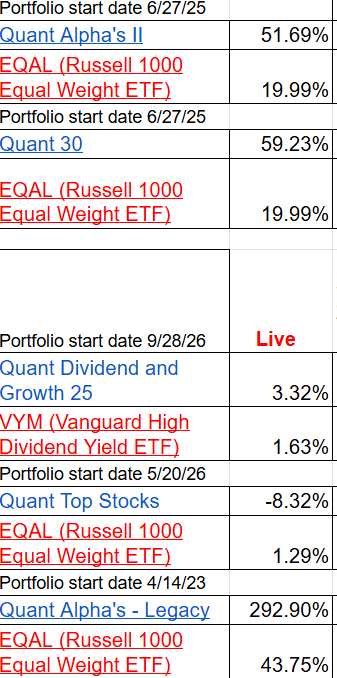
- Quant Alpha’s II – Up over 51% since June 2025
- Quant 30 – Up over 59% since June 2025
- Quant Alpha’s – Legacy – Up over 290% since April 2023
- Education – Third-Quarter Earnings Season: What the Big Banks Will Tell Us About the Economy
- Quick Links
USA Stock market week ending 10/16/26
- SPY (S&P 500): -2.0% — Large-cap stocks declined over the week.
- ^IXIC (Nasdaq Composite): -4.4% — Technology-heavy stocks saw a sharp pullback.
- DIA (Dow Jones Industrial Average): +0.6% — Blue-chip stocks posted a modest gain, outperforming the broader market.
- IWM (Russell 2000): -3.0% — Small-cap stocks weakened and underperformed large-cap shares.
- SPMO (S&P 500 Momentum ETF): -6.8% — Momentum stocks suffered the steepest decline among the listed indexes, signaling significant weakness among recent market leaders.
Market Drivers this Week (10/19/26 – 10/23/26)
- Tuesday, 10/20 — September housing starts and building permits are scheduled for 8:30 a.m. ET, followed by pending home sales at 10:00 a.m. Netflix reports after the close, with subscriber trends, advertising growth, and its outlook in focus. GE Aerospace, General Motors, and RTX also report.
- Wednesday, 10/21 — Tesla and Meta Platforms report third-quarter results after the close.
- Thursday, 10/22 — Valero Energy reports Q3 results before the market opens, offering an update on refining margins and fuel demand. Weekly jobless claims are due at 8:30 a.m. ET, followed by the Conference Board’s Leading Economic Index at 10:00 a.m. and the Kansas City Fed Manufacturing Survey later in the morning.
- Friday, 10/23 — S&P Global’s U.S. flash Manufacturing and Services PMIs are scheduled for 9:45 a.m. ET, followed by the University of Michigan’s final October consumer-sentiment reading at 10:00 a.m. American Express and SLB also report earnings.
The CNN Fear & Greed Index
The CNN Fear & Greed Index plunged to 18 (Extreme Fear) on October 16, down sharply from 45 (Neutral) the previous week, signaling a rapid deterioration in investor sentiment. This marks a 27-point weekly decline and a 47-point drop from the August 14 reading of 65 (Greed). Sentiment weakened steadily through late August and September, with the index remaining in Fear territory for five consecutive weeks before briefly recovering to Neutral on October 9. That rebound proved short-lived, with the latest reading indicating renewed anxiety among investors. Market sentiment has shifted decisively from Greed in August to Extreme Fear in mid-October, reflecting heightened caution and uncertainty.
- 10/16/26 – 18 Extreme Fear
- 10/9/26 – 45 Neutral
- 10/2/26 – 31 Fear
- 9/25/26 – 37 Fear
- 9/18/26 – 29 Fear
- 9/11/26 – 33 Fear
- 9/4/26 – 42 Fear
- 8/28/26 – 54 Neutral
- 8/21/26 – 55 Neutral
- 8/14/26 – 65 Greed
The Quant Model Portfolios had a bad past week as the Risk Off trend deepened. The SPMO (S&P 500 Momentum ETF) was down -6.8% for the week as an example. Several of the best performers in the Quant Portfolios are well off their 52 week highs. For example: CLS -30%, POWL -50%, MU -30%, LITE -28% and SNDK -45%. As long of the companies continue to perform well as a business, the price will eventually fully reflect that. In the past these big panic sells hitting the fastest growing stocks, has been a good time to add to favorite positions.

Note: You are reading the free subscriber newsletter. Paid subscribers enjoy instant access to weekly Model Portfolio updates upon release. Free subscribers get access to Portfolio updates after a four week or more delay. Want timely access to the new Adds/Removes? Subscribe
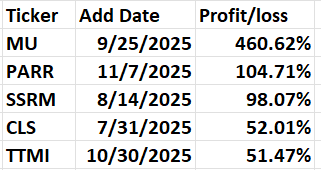
Model Portfolio Quant Alpha’s II
This week’s new update, if any, is being released to the paid subscribers. This Portfolio continues to significantly outperform its benchmark, 51% versus 19%. It has 30 members.
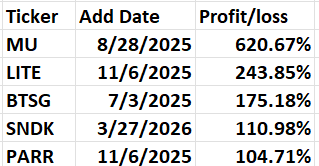
Model Portfolio Quant 30
This week’s new update, if any, is being released to the paid subscribers. This Portfolio continues to beat its benchmark by a wide margin, 59% to 19%. It has 30 members in it.
Model Portfolio Dividend and Growth 25
This week’s new update if any is being released to the paid subscribers. The Portfolio is up +3% and the benchmark was up +1% since inception.
Model Portfolio Quant Top Stocks
The portfolio is -8% with the benchmark +1%.
A Thursday morning post will update the Adds and Removals for this Portfolio.
Added Thursday: DINO (HF Sinclair Corporation)
Remove: NESR (National Energy Services Reunited)
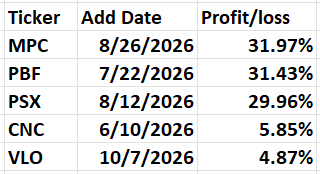
Model Portfolio Quant Alpha’s – Legacy
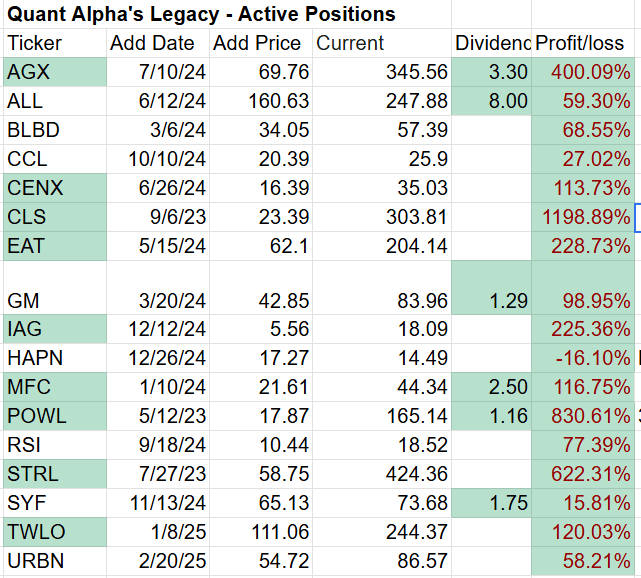
The portfolio is up over +290% since it began in 2023. It has 17 stocks in it. Powell industries is now a 8 bagger. Celestica is now a 11 bagger

Performance to 10-16-2026

Third-Quarter Earnings Season: What the Big Banks Will Tell Us About the Economy
Third-quarter earnings season gets underway this week, with JPMorgan Chase, Goldman Sachs, Citigroup, and Wells Fargo reporting on Tuesday, October 13. Bank of America and Morgan Stanley follow on Wednesday, October 14, while U.S. Bancorp and Charles Schwab report Thursday, October 15.
Investors will look beyond headline earnings to assess how higher interest rates, rising Treasury yields, consumer spending, and financial-market activity are affecting the banking industry. Here are five key things to watch.
Net Interest Income in a Higher-Rate Environment
The Federal Reserve raised its benchmark rate by 25 basis points in September, bringing the target range to 3.75%–4.00%, while long-term Treasury yields have climbed to multidecade highs. Higher rates can support banks’ net interest income (NII), but the benefit depends on how quickly loan yields adjust relative to deposit costs and other funding expenses.
Visible Alpha’s estimates call for year-over-year NII growth of 7.7% at Bank of America, 11% at Citigroup, and 5.5% at Wells Fargo. However, the outlook for net interest margins differs: Bank of America is expected to see modest improvement, while Citigroup and Wells Fargo face further margin pressure. Investors should watch actual NII results and management’s updated full-year guidance to determine whether higher rates are translating into sustainable earnings growth.
Trading Revenue and Investment Banking
Capital-markets performance could be a major source of variation among the banks. JPMorgan has projected mid-to-high-teens growth in investment banking fees and trading revenue, while Bank of America expects investment banking fees to decline by at least 10% and sales-and-trading revenue to remain approximately flat.
Credit Quality and Loan-Loss Provisions
Credit quality remains broadly stable, but analysts expect provisions for potential loan losses to normalize from unusually low levels. Rising provisions do not automatically signal financial distress, but unexpected increases—particularly in consumer lending—could indicate that banks are becoming more concerned about borrowers’ ability to repay.
Consumer Health and Loan Demand
Bank earnings can provide a useful window into the condition of the U.S. economy. Wells Fargo has indicated that its 2026 loan growth could exceed its previous forecast and that consumer spending and credit trends remain healthy.
Can Earnings Offset Higher Yields and Inflation?
The broader S&P 500 is expected to deliver approximately 29.5% year-over-year earnings growth in Q3, according to current FactSet-related reporting. Reuters reports that third-quarter earnings for the largest U.S. banks are expected to rise by as much as 20% year over year, although forecasts differ considerably among individual institutions.
In Summary
Bank earnings will offer an important test of financial-sector resilience. Strong NII, stable credit quality, and continued loan growth would be encouraging, but rising funding costs, weaker dealmaking, or deteriorating consumer credit could undermine the outlook.
Quick Links
- Live Scorecard
- Model Portfolio Quant Alpha’s II
- Click here for the Quant Alpha’s II details
- Model Portfolio Quant 30
- Click here for the Quant 30 details
- Model Portfolio Quant Dividend and Growth 25
- Model Portfolio Quant Top Stocks
- Click here for the Quant Top Stocks details
- Model Portfolio Quant Alpha’s – Legacy
- Click here for the Quant Alpha’s – Legacy details
- Position Trader educational blog posts
- Position Trader – blog post user guide
All content on this site is for informational purposes only and does not constitute financial advice. Consult relevant financial professionals in your country of residence to get personalized advice before you make any trading or investing decisions. This post was written with the assistance of artificial intelligence. The original ideas and final review are human-generated. Disclaimer
Copyright 2023-2026 SwingTrader.Trading. All Rights Reserved.

