
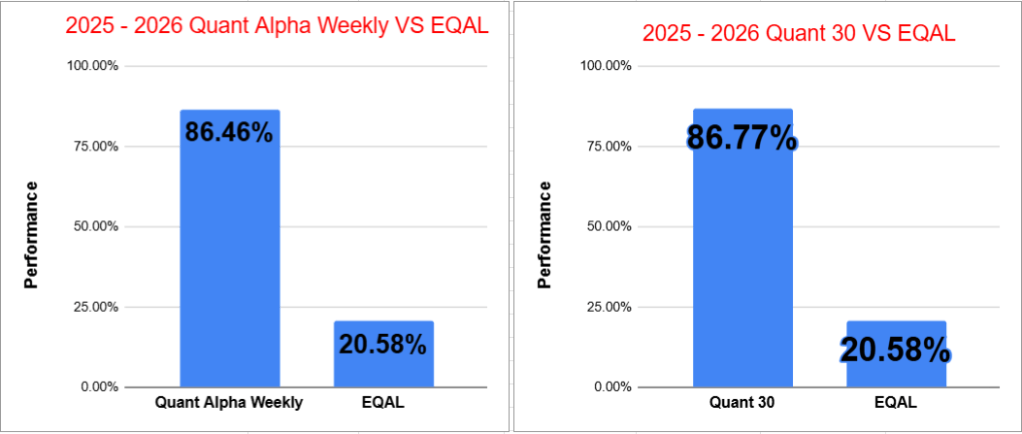
- Quant Weekly – Up over 86% since June 2025
- Quant 30 – Up over 86% since June 2025
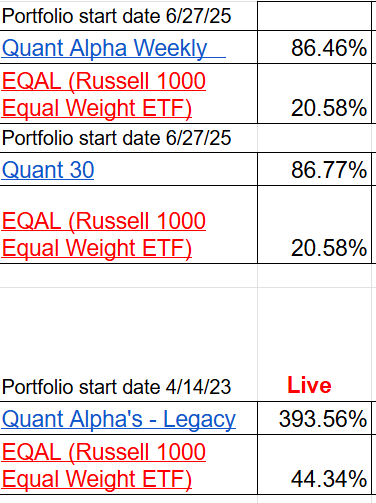
- Legacy – Up over 390% since April 2023
- Top Quant Stocks – Top Dividend stocks – performance review
- Education – Is It a Good Idea to Buy Stocks Near Their 52-Week Lows?
- Argan (AGX) became the latest 10X MultiBagger this week in the Legacy Portfolio.
USA Stock market week ending 06/26/26
- S&P 500 (SPY): -2.7% – The broader market posted a notable weekly decline, giving back a portion of its recent gains.
- Nasdaq Composite (^IXIC): -3.3% – Technology and growth stocks led the market lower, resulting in the weakest performance among the major indexes.
- Dow Jones Industrial Average (DIA): +0.1% – The Dow finished essentially flat, showing relative resilience compared with the broader market.
- Russell 2000 (IWM): +0.5% – Small-cap stocks outperformed the large-cap indexes and managed to post a modest weekly gain.
Market Drivers this Week (06/29/26 – 07/03/26)
Tuesday, 6/30 — Nike Earnings in Focus
Wednesday, 7/01 — Manufacturing, Jobs Preview, and Fed Speak
- ISM Manufacturing PMI and ADP Employment Report are released in the morning.
- Fed Chair Kevin Warsh is scheduled to speak at an ECB symposium in Portugal.
Thursday, 7/02 — Jobs Report Takes Center Stage
- June Nonfarm Payrolls and Weekly Jobless Claims are released at 8:30 AM ET.
- ISM Services PMI is also scheduled for release.
- Markets close early at 1:00 PM ET ahead of the Independence Day holiday.
Friday, 7/03 — Markets Closed
The CNN Fear and Greed Index ends the week at 25 in the Extreme Fear area. This is the first week in the Extreme Fear area after spending three weeks in a row in the Fear area. Caution is advised in adding new positions for short term gain in this Risk Off environment.
The Quant Model Portfolios all faired well considering the S&P 500 and Nasdaq both saw sizable drops last week. All three had small loses. Argan (AGX) became a 10X MultiBagger this week for the first time.

Note: You are reading the free subscriber newsletter. Paid subscribers enjoy instant access to weekly Model Portfolio updates upon release and a Top Quant Stocks list. Free subscribers get access to Portfolio updates after a three-week delay but no Top Quant Stocks list. Want timely access to the new Adds/Removes and Top Quant Stocks list? Subscribe
Model Portfolio Quant Alpha Weekly
Any newly added stock is being released to Paid Subscribers today. Below are the updates from three weeks ago. This Portfolio continues to significantly outperform its benchmark, 86% versus 20%. It has 26 members.
Top five Quant stocks in the Portfolio (Paid subscribers only).
Add (06/05/26) : None
Outperformers: SSRM (SSR Mining) up over +80%, MU (Micron Technology) up over +620%, TTMI (TTM Technologies) up over +200%, CLS (Celestica) up over +60%
Model Portfolio Quant 30
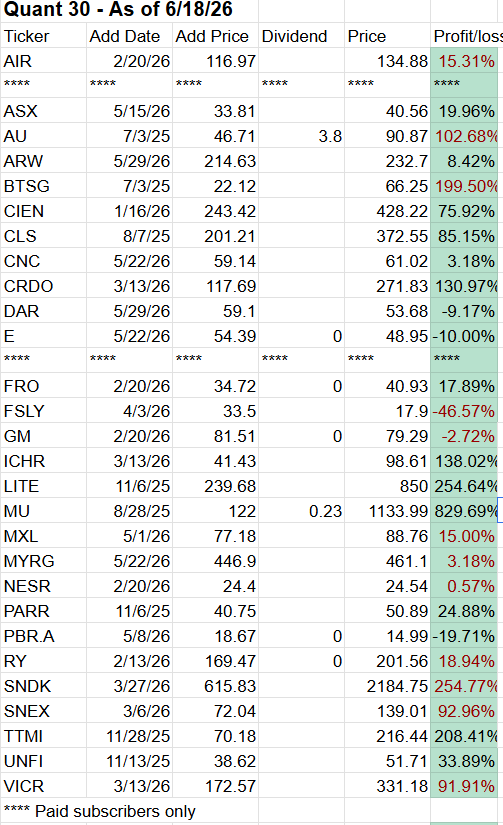
This week’s new update, if any, is being released to the paid subscribers. Shown below is the update made three weeks ago. This Portfolio continues to beat its benchmark by a wide margin, 86% to 20%. It has 30 members in it.
KGC (Kinross Gold) is being removed from the Portfolio this week. It was added on 7/5/25 and leaves the Portfolio at +65%.
Top five Quant stocks in the Portfolio (Paid subscribers only).
Add (06/05/26): AMD (Advanced Micro Devices) – Semiconductors
Remove (06/05/26): KGC (Kinross Gold)
Outperformers: MU (Micron Technology) up over +820%, LITE (Lumentum Holdings) up over +240%, TTMI (TTM Technologies) up over +170%, BTSG (BrightSpring Health) up over +210% and SNDK (Sandisk) up over +230%
Model Portfolio Quant Alpha’s – Legacy
The portfolio is up over +390% since it began in 2023. It has 17 stocks in it. Powell industries is now a 14 bagger. Celestica is now a 13 bagger. Sterling Infrastructure has become a 12 bagger and now Argan has become a 10 bagger.
Argan (AGX) made it to 10 bagger status for the first time this week.
Top five Quant stocks in the Portfolio (Paid subscribers only).
Remove (06/05/26): None
Outperformers: AGX (Argan) up over +1000%, STRL (Sterling Infrastructure) up over +1200%, POWL (Powell Industries) up over +1400% and CLS (Celestica) is up over +1300%

Performance to 06-26-2026
Top Quant Stocks for this week – (Paid subscribers only feature)
Top Dividend Stocks were last listed on April 10, 2026. Here are the results since then. Paid subscribers saw the list in a timely manner. Free subscribers did not see it at all.
- 4/10/26 thru 6/26/26
- Top Divided Stocks = Average +10.45% each 10 selections
- VYM (Vanguard High Dividend Yield Index Fund) = +4.7%

Is It a Good Idea to Buy Stocks Near Their 52-Week Lows?
Pros
Large Price Declines Can Create Opportunity
- A stock near its 52-week low has often already absorbed significant bad news and investor pessimism.
- Opportunities arise when the stock price falls much more than the company’s intrinsic value.
- Examples include Meta Platforms (2022), American Express (1960s), and Apple during temporary product-cycle concerns.
- In these cases, the businesses remained strong while investor sentiment became excessively negative.
Institutional and Tax-Related Selling Can Create Mispricings
- Fund redemptions, index rebalancing, tax-loss harvesting, and margin calls can force investors to sell regardless of fundamentals.
- These selling pressures can temporarily push stocks below fair value.
- Tax-loss selling often creates opportunities in November and December.
- The January rebound effect has historically benefited some heavily sold stocks.
Contrarian Investing Often Requires Buying Unpopular Stocks
- The 52-week low list is usually filled with stocks facing negative headlines and weak sentiment.
- Superior returns often require buying when others are fearful.
- Howard Marks frequently emphasizes the importance of being a thoughtful contrarian.
- The best opportunities rarely feel comfortable at the time of purchase.
Temporary Problems Can Create Attractive Entry Points
- Great businesses occasionally face cyclical downturns, earnings misses, product delays, or industry-wide fears.
- Temporary problems can create attractive long-term entry points.
- Examples include Meta Platforms (2022), Microsoft (2000–2013), and many high-quality banks during financial panics.
- The key is determining whether the problem is temporary rather than permanent.
The 52-Week Low List Is an Excellent Research Tool
- Many successful investors use new-low lists as idea generators.
- The list naturally highlights companies experiencing stress and investor pessimism.
- A stock’s appearance on the list should trigger research, not an automatic purchase.
- Asking “Why is this stock at a 52-week low?” often leads to valuable insights.

Cons
Many Stocks Are at 52-Week Lows for Good Reasons
- Some businesses face permanent deterioration rather than temporary setbacks.
- A low stock price does not automatically mean a stock is undervalued.
- Examples include Kodak, Blockbuster, Sears, and RadioShack.
- These stocks appeared cheap repeatedly before ultimately collapsing.
Value Traps Can Continue Falling for Years
- A value trap looks inexpensive but becomes cheaper because the business continues deteriorating.
- Investors often mistake a declining stock for a bargain.
- Many energy companies during the 2014–2016 commodity collapse became value traps.
- Numerous speculative growth stocks after 2021 continued falling despite appearing inexpensive.
Momentum and Earnings Revisions Often Work Against You
- Stocks frequently continue falling after reaching new lows.
- Earnings estimates often continue declining after the initial selloff.
- Analysts may cut forecasts for several quarters before conditions stabilize.
- Buying too early can result in significant drawdowns before any recovery begins.
A 52-Week Low Tells You Nothing About Valuation
- A stock at a 52-week low is simply trading below where it traded a year ago.
- The price alone reveals nothing about intrinsic value.
- A stock can fall from 100x earnings to 80x earnings and still be expensive.
- Valuation must be assessed using earnings, cash flow, assets, and future prospects.
Sector Concentration Can Increase Risk
- The 52-week low list is often dominated by one or two struggling sectors.
- Investors can unintentionally become concentrated in the market’s weakest areas.
- In 2022, many technology and growth stocks dominated the list.
- During commodity downturns, energy and mining stocks frequently dominate new-low screens.
Bottom Line
The 52-week low list is a tool, not a strategy.
- Used as a research screen, it can uncover quality businesses experiencing temporary setbacks.
- Used as a buy signal by itself, it can lead investors directly into value traps.
Before buying a stock near its 52-week low, ask:
- Is the business fundamentally sound?
- Is the problem temporary and fixable?
- Is management capable and trustworthy?
- Is the balance sheet strong?
- Is the stock genuinely undervalued?
If the answers are yes, a 52-week low may represent opportunity.
If the answers are no—or unknown—the stock may simply be warning investors that deeper problems exist beneath the surface.
Quick Links
- Live Scorecard
- Model Portfolio Quant Alpha Weekly
- Click here for the Quant Alpha Weekly details
- Model Portfolio Quant 30
- Click here for the Quant 30 details
- Model Portfolio Quant Alpha’s – Legacy
- Click here for the Quant Alpha’s – Legacy details
- Position Trader educational blog posts
- Position Trader – blog post user guide
All content on this site is for informational purposes only and does not constitute financial advice. Consult relevant financial professionals in your country of residence to get personalized advice before you make any trading or investing decisions. This post was written with the assistance of artificial intelligence. The original ideas and final review are human-generated. Disclaimer
Copyright 2023-2026 SwingTrader.Trading. All Rights Reserved.


You must be logged in to post a comment.